Download
1 / 7
70 likes | 83 Views
This Quantum Dots Global Market and Patent Landscape Report, 2018 to 2022 research on Technology overview, Business and patent landscape, Market forecast and emerging trend

E N D
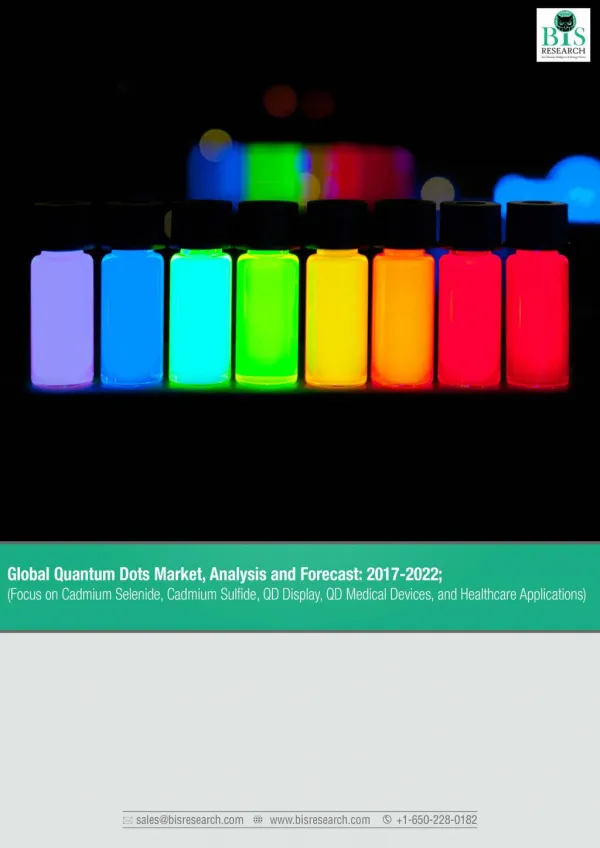
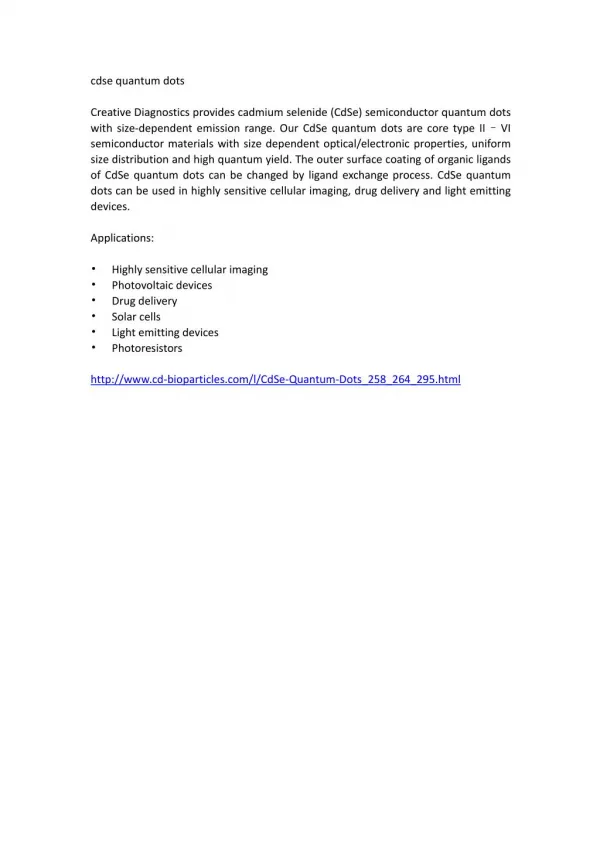
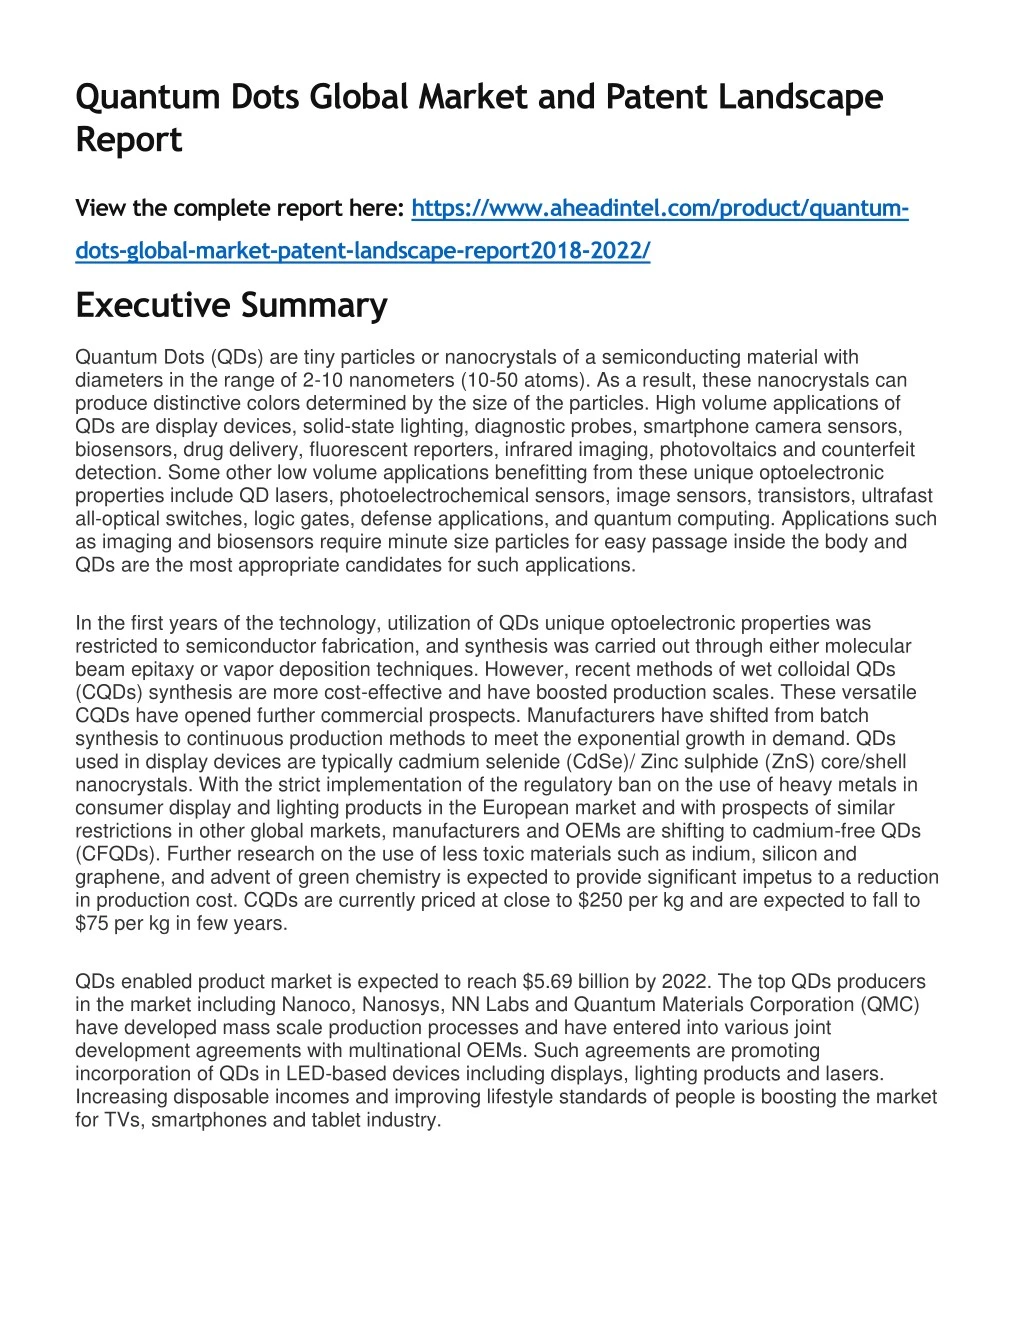
Quantum Dots Global Market and Patent Landscape Report View the complete report here: https://www.aheadintel.com/product/quantum- dots-global-market-patent-landscape-report2018-2022/ Executive Summary Quantum Dots (QDs) are tiny particles or nanocrystals of a semiconducting material with diameters in the range of 2-10 nanometers (10-50 atoms). As a result, these nanocrystals can produce distinctive colors determined by the size of the particles. High volume applications of QDs are display devices, solid-state lighting, diagnostic probes, smartphone camera sensors, biosensors, drug delivery, fluorescent reporters, infrared imaging, photovoltaics and counterfeit detection. Some other low volume applications benefitting from these unique optoelectronic properties include QD lasers, photoelectrochemical sensors, image sensors, transistors, ultrafast all-optical switches, logic gates, defense applications, and quantum computing. Applications such as imaging and biosensors require minute size particles for easy passage inside the body and QDs are the most appropriate candidates for such applications. In the first years of the technology, utilization of QDs unique optoelectronic properties was restricted to semiconductor fabrication, and synthesis was carried out through either molecular beam epitaxy or vapor deposition techniques. However, recent methods of wet colloidal QDs (CQDs) synthesis are more cost-effective and have boosted production scales. These versatile CQDs have opened further commercial prospects. Manufacturers have shifted from batch synthesis to continuous production methods to meet the exponential growth in demand. QDs used in display devices are typically cadmium selenide (CdSe)/ Zinc sulphide (ZnS) core/shell nanocrystals. With the strict implementation of the regulatory ban on the use of heavy metals in consumer display and lighting products in the European market and with prospects of similar restrictions in other global markets, manufacturers and OEMs are shifting to cadmium-free QDs (CFQDs). Further research on the use of less toxic materials such as indium, silicon and graphene, and advent of green chemistry is expected to provide significant impetus to a reduction in production cost. CQDs are currently priced at close to $250 per kg and are expected to fall to $75 per kg in few years. QDs enabled product market is expected to reach $5.69 billion by 2022. The top QDs producers in the market including Nanoco, Nanosys, NN Labs and Quantum Materials Corporation (QMC) have developed mass scale production processes and have entered into various joint development agreements with multinational OEMs. Such agreements are promoting incorporation of QDs in LED-based devices including displays, lighting products and lasers. Increasing disposable incomes and improving lifestyle standards of people is boosting the market for TVs, smartphones and tablet industry.
Geographically, Americas led the QDs market in 2014 with 56.83 percent of market revenue share emerging from this region, followed by Europe and then APAC. However, in 2017 APAC’s contribution to the market revenue rose to 27.99 percent which makes it the second biggest geographical region regarding QDs dynamics. APAC is forecasted to assume the top position in revenue generation by 2022. Substantial research efforts have been made around LED-based devices with a focus on improving wide color gamut, production cost, and energy efficiency. Patent landscape analysis confirms the market interest with increase in patenting activity at a CAGR of 10.08 percent over the period from 2007 to 2016. Samsung and LG are the pioneers in research and development. TCL group and BOE Technology Group are the new entrants in QDs technology with significant patenting activity after 2014. R&D in the application of QDs in biomedical devices like probes and sensors is providing a boost to patent applications in this segment. Majority activity in R&D is taking place in APAC with China leading the way. One of the critical emerging geographies from technology innovation perspective is India which is showing trends of active patent fillings at a CAGR of 43 percent. United States has the second largest QDs patent portfolio but is showing a decline in interest over the years with patent CAGR being negative.
Further penetration of the technology in other segments such as defense, quantum computing and memory will provide the essential future growth thrust to the market. QDs defense market is expected to contribute modest revenues initially but is expected to grow at a CAGR of approximately 52 percent by 2022. There is also a growing need for a clean and green source of energy to reduce the carbon footprint. As a result, QDs based photovoltaics are gaining huge interests. QDs technology in healthcare is expected to become a one-billion-dollar industry by 2022. Market for QDs is continuously growing both at industry as well as application level. Today’s market is focusing on QD displays, but tomorrow may bring in new era of medical, laser and photovoltaics. QDs will keep on evolving with newer innovations in production and application aspects.
Table of Content Chapter 1 Introduction Study Goals Key Target Audience Scope Of The Report Chapter 2 Technology Overview Introduction To Quantum Dots Key Properties Source Classification Structural Classification Production Technologies Application Key Qds Vendors Chapter 3 Business Landscape And Forecast Market Overview Market Size And Forecasts Market Segmentation By Product Technology Display Other Products Market Segmentation By Material Market Segmentation By Industry Electronics Biomedical Defense And Security Market Segmentation By Region Apac Emea Americas Porter’s Market Analysis Chapter 4 Market Drivers and Challenges Market Drivers Market Challenges
Chapter 5 Patent and IPR Landscape Introduction Search Methodology Patent Categories And Classification Patent Activity Grant Time Leading Patent Players Key Assignees Key Inventors Academic Vs Corporate Collaboration Networks Technical Analysis Of Patent Landscape Patent Segmentation By Product Technology Patent Segmentation By Material Composition Patent Segmentation By Industry Patent Segmentation By The Manufacturing Process Patent Segmentation By Region Patent Licensing And Litigation Patent Litigation Patent Acquisition Patent Licensing Chapter 6 Appendix Acronyms, Abbreviations, and Units Disclaimer Methodology And Information Sources Analyst Profile Table of Tables (12 Tables) Table 1: QDs end uses segmented by industry Table 2: QDs imaging market competitors Table 3: OLED vs. QDs display market (2017-2022) Table 4: CPC categories Table 5: Samsung patent portfolio size – current assignee wise Table 6: LG patent portfolio size – current assignee wise Table 7: QDs patent categories Table 8: Level 1 and Level 2 product technology categories with the number of patents Table 9: Patent distribution of top 15 companies across level 2 product technology categories
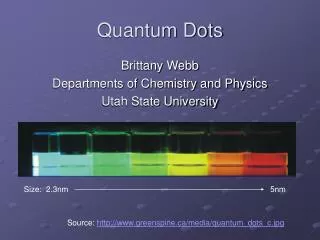
Table 10: Patent portfolio of top 15 companies across different material segments Table 11: Number and evolution of patent families per office of first filling- top 15 Table 12: Key litigation cases Table of Figures (57 Figures) Figure 1 QDs fluorescence effect Figure 2 Photoluminescence of alloyed CdSxSe1-x/ZnS quantum dots of 6nm diameter. The material emits different color of light by tuning the composition Figure 3 Colloidal synthesis of CdSe quantum dots. TOP trioctylphosphine, TOPO trioctylphosphine oxide Figure 4 Fabrication method for QDs production Figure 5 Plasma synthesis process for QDs production Figure 6 Electrochemical assembly process for QDs production Figure 7 Schematic for QDs color spectrum Figure 8 Schematic structure of the QD intermediate band in solar cell Figure 9 Schematic diagram of countermeasure systems using QD cloud decoy Figure 10 Schematic diagram of QD transistors Figure 11: Global QDs market revenue (in $ million): 2017 to 2022 Figure 12: Global QDs production capacity 2018-2022 (in kg/year) Figure 13: Global QDs product technology market share in percentage Figure 14: Global QDs product technology market share in $Million Figure 15: Global QDs market percentage share of type of display devices Figure 16: Global QDs market by other products application for 2017-2022 Figure 17: Global QDs market break up for other products application for 2017-2022 Figure 18: QDs display market forecast breakup in 2015 by material (Cd QD and CFQD volume in percentage breakup) Figure 19: QDs display market forecast breakup in 2022 by material (Cd QD and CFQD volume in percentage breakup) Figure 20: Global QDs market forecast for 2018-2022 segmented by industry (in $million) Figure 21: Global QDs market forecast for APAC region for 2018-2022 Figure 22: Global QD market forecast for EMEA region for 2018-2022 Figure 23: Global QD market forecast for AMERICAS region for 2018-2022 Figure 24: Global UHD unit shipment (2016 to 2022) Figure 25: Schematic diagram to represent key steps in patent analysis process Figure 26: Overview of QDs technology Figure 27: Top 15 QD patents classification categories as per CPC Figure 28: Global QDs patent activity trend Figure 29: Average time taken to grant patents in different countries Figure 30: Top 20 patent assignees in the QD patent landscape with respect to their portfolio size Figure 31: Trends for patent portfolio size– current assignee wise Figure 32: Top 20 influencers Figure 33: Samsung patent portfolio size – current assignee wise
Figure 34: Samsung forward citation analysisFigure 35: Samsung patent portfolio segmented by technology, industry and material composition Figure 36: LG patent portfolio legal status Figure 37: LG forward citation map Figure 38: LG patent portfolio legal status Figure 39: TCL patent portfolio legal status Figure 40: TCL patent portfolio segmented by technology, industry and material Figure 41: TCL patent portfolio trend Figure 42: TCL patent citation network Figure 43: Key inventors Vs type of patent applicant Figure 44: Key inventors with priority country Figure 45: Analysis of patent applicant profile Figure 46: Collaboration networks-Co-assignment Figure 47: QDs technology category patents segmented at level 3 Figure 48: QDs patent landscape segmented by material composition Figure 49: QDs patent landscape segmented by industry Figure 50: QDs patent landscape trends segmented by industry Figure 51: QDs patent portfolio size of top 20 assignees in defense industry Figure 52: QDs patent portfolio size of top 20 assignees in pharmaceutical industry Figure 53: QDs patent portfolio size of top 20 assignees in electronics industry Figure 54: QDs patent portfolio size of top 20 assignees in manufacturing of qds Figure 55: Major offices of first fillings linked to their region Figure 56: Geographic map of R&D in the field of QDs technology (office of first filling) Figure 57: Representation of market opportunities of QDs technology Keywords - Quantum Dots Global Market and Patent Landscape Report by Technology (Colloidal Synthesis, Fabrication Method, Viral Assembly, Plasma Synthesis, Electrochemical Assembly) by Applications (Displays, Solar Cell, Photodetectors / Sensors, Batteries and Energy Storage, Quantum computing) By Patent Activities (Patent Categories and Classification, Leading Patent Players, Technical Analysis of Patent Landscape, Patent Licensing And Litigation) – Global Forecast, 2022