Download
1 / 12
120 likes | 130 Views
Macroeconomic Impact of the Coronavirus: A new perspectiveu2026 Back in the early phases of the Coronavirus I was optimistically convinced our industry would be driven into a u201cVu201d recovery based on the U.S. governmentu2019s response.

E N D
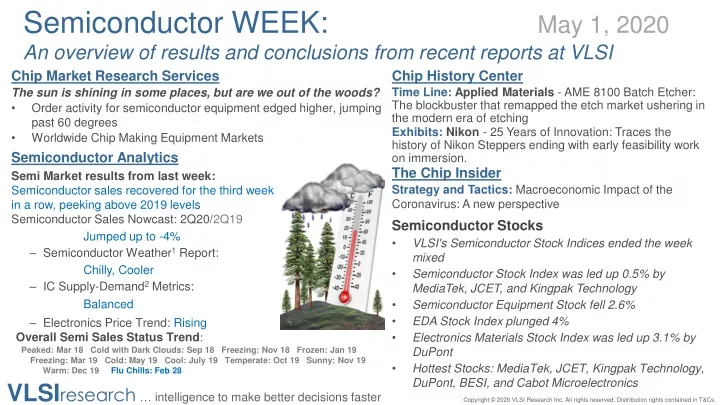
Semiconductor WEEK: May 1, 2020 An overview of results and conclusions from recent reports at VLSI Chip Market Research Services The sun is shining in some places, but are we out of the woods? • Order activity for semiconductor equipment edged higher, jumping past 60 degrees • Worldwide Chip Making Equipment Markets Semiconductor Analytics Semi Market results from last week: Semiconductor sales recovered for the third week in a row, peeking above 2019 levels Semiconductor Sales Nowcast: 2Q20/2Q19 Jumped up to -4% – Semiconductor Weather1Report: Chilly, Cooler – IC Supply-Demand2Metrics: Balanced – Electronics Price Trend: Rising Overall Semi Sales Status Trend: Peaked: Mar 18 Cold with Dark Clouds: Sep 18 Freezing: Nov 18 Frozen: Jan 19 Freezing: Mar 19 Cold: May 19 Cool: July 19 Temperate: Oct 19 Sunny: Nov 19 Warm: Dec 19 Flu Chills: Feb 28 Chip History Center Time Line: Applied Materials - AME 8100 Batch Etcher: The blockbuster that remapped the etch market ushering in the modern era of etching Exhibits: Nikon - 25 Years of Innovation: Traces the history of Nikon Steppers ending with early feasibility work on immersion. The Chip Insider Strategy and Tactics: Macroeconomic Impact of the Coronavirus: A new perspective Semiconductor Stocks • VLSI's Semiconductor Stock Indices ended the week mixed • Semiconductor Stock Index was led up 0.5% by MediaTek, JCET, and Kingpak Technology • Semiconductor Equipment Stock fell 2.6% • EDA Stock Index plunged 4% • Electronics Materials Stock Index was led up 3.1% by DuPont • Hottest Stocks: MediaTek, JCET, Kingpak Technology, DuPont, BESI, and Cabot Microelectronics VLSIresearch … intelligence to make better decisions faster Copyright © 2020 VLSI Research Inc. All rights reserved. Distribution rights contained in T&Cs.
The Chip Insider®'s Graphics File April 2020 The sun is shining in some places, but are we out of the woods? • Order activity for semiconductor equipment edged higher, jumping past 60 degrees • Equipment suppliers continue to see solid demand in Q2; however, order visibility in the second half of the year is very limited due to uncertainty from the COVID-19 fallout • Q1 sales for ICs are coming in much better than feared • The outlook in the second half remains challenging as the industry will grapple with growing inventories and the fallout from COVID-19. • VLSI’s Chip Price Performance Index (CPPI) extended its decline • IC Inventories are rising again This issue contains the latest forecast. VLSIresearch … intelligence to make better decisions faster Call us to access more details Copyright © 2020 VLSI Research Inc. All rights reserved. Distribution rights contained in T&Cs.
Mild COVID-19 impact, recovery 3Q20--VLSI Forecast Forecast as of March 2020: Semi Equipment ($B): Sequential Change Capacity Utilization: ICs ($B): Sequential Change IC Units (BU): Sequential Change Electronics ($B) : Sequential Change 2021 84.9 $ 17.6% 89.1% 418.0 $ 24.0% 342.1 20.1% 2,362 $ 16.9% 2019 $ -8.0% 84.6% 352.3 $ -13.4% 299.4 -6.0% 2,122 $ -2.0% 2020 72.2 $ -6.3% 82.9% 337.1 $ -4.3% 284.9 -4.9% 2,020 $ -4.8% 77.0 Moderate COVID-19 impact, recovery in 4Q20 Forecast as of March 2020: Semi Equipment ($B): Sequential Change ICs ($B): Sequential Change IC Units (BU): Sequential Change Electronics ($B) : Sequential Change Severe COVID-19 impact, recovery 1Q21 Forecast as of March 2020: Semi Equipment ($B): Sequential Change ICs ($B): Sequential Change IC Units (BU): Sequential Change Electronics ($B) : Sequential Change 2021 84.9 $ 33.9% 418.0 $ 37.9% 342.1 34.1% 2,362 $ 25.3% 2021 84.9 $ 52.4% 418.0 $ 48.1% 342.1 43.7% 2,362 $ 35.8% 2019 $ -8.0% 352.3 $ -13.4% 299.4 -6.0% 2,121.9 $ -2.0% 2020 63.4 $ -17.7% 303.1 $ -14.0% 255.1 -14.8% 1,885 $ -11.2% 2019 $ -8.0% 352.3 $ -13.4% 299.4 -6.0% 2,122 $ -2.0% 2020 55.7 $ -27.7% 282.2 $ -19.9% 238.1 -20.5% 1,739 $ -18.0% 77.0 77.0 VLSIresearch … intelligence to make better decisions faster Copyright © 2020 VLSI Research Inc. All rights reserved. Distribution rights contained in T&Cs.
The Chip Insider®Graphics Worldwide Chip Making Equipment Markets • Equipment market is weakening amid growing uncertainty Worldwide Chip Making Equipment Markets: Chart shows rolling averages in $B for semiconductor equipment orders and revenues, contrasted against a 36-month rolling average of revenues VLSIresearch … intelligence to make better decisions faster Copyright © 2020 VLSI Research Inc. All rights reserved. Distribution rights contained in T&Cs.
Semiconductor Analytics Last Week in the Semiconductor Market: Semiconductor sales recovered for the third week in a row, peeking above 2019 levels for the first time, as COVID-19 adjustments dampened. Semiconductor Supply-Demand rose to Tight conditions. The 2Q20 Nowcast improved substantively. But with only 3 weeks, this is moving a lot. . Semiconductor Sales Nowcast: 2Q20/2Q19 Jumped up to -4% Semiconductor Weather1Report: 64˚ F Chilly. Cooler IC Supply-Demand2Metrics: Balanced Electronics Pricing Trend: Rising Notebooks, Smartphones, and Consumer Electronics have a seasonal inversion driven by WAHE (Work-at-Home Economy) W/W: Week-over-Week sequential growth W/Q: Week-over-Quarter W/Y: Week-over-Year Thank you for supporting us through this last issue of 2018. Semiconductor Analytics will return January . Overall Semi Sales Status Trend: Peaked: Mar 18 Cold with Dark Clouds: Sep 18 Freezing: Nov 18 Frozen: Jan 19 Freezing: Mar 19 Cold: May 19 Cool: July 19 Temperate: Oct 19 Sunny: Nov 19 Warm: Dec 19 Flu Chills: Feb 28 1: Measures Order Activity 2: Measures Pricing Power VLSIresearch … intelligence to make better decisions faster Copyright © 2020 VLSI Research Inc. All rights reserved. Distribution rights contained in T&Cs.
2020 Semiconductor Market Drivers Coronavirus has driven Integrated Circuit sales towards recession: • Certainties: – Coronavirus Pandemic infected economies • Unparalleled Supply and Demand shocks to IC sales of <10% and units of ~20% – Macroeconomic ‘V’acuum or ‘U’ – not ‘L’ – WAHE (Work-At-Home Economy) – 7/10nm and 5/7nm demand ramps – Memory Price Elasticity – 5G: Smartphone, Auto, Industrial • Uncertainties: – Ability of Governments to defibrillate economy out of shelter-in-place – 2020 Elections in U.S. VLSIresearch … intelligence to make better decisions faster Copyright © 2020 VLSI Research Inc. All rights reserved. Distribution rights contained in T&Cs.
The Chip Insider® Strategy & Tactics slowdown in the semiconductor industry would spread into an unprecedented third year… Strategy and Tactics: Macroeconomic Impact of the Coronavirus: A new perspective. Coronavirus Semiconductor Sales Watch: It’s been 11 weeks since the WHO declared the COVID-19 emergency. Over that time, the impact on the semiconductor industry was initially a classic shortage response, with prices soaring. Then demand evaporated as the market figured out this was no instantaneous hit like the Sendai Earthquake and that there would be few limitations on production out of wafer fabs. This reversed when the market learned production was being constrained by shutdowns of Asia-based test and packaging capacity due to quarantines in those areas. What emerged was a very volatile greed-fear cycle, as unit buys swung between inventory investing and divesting ranges. After 11 weeks, IC sales are within a … units and prices are … The depth of the … drop is similar to the 2009 H1N1 Swine Flu … Summaries: Macroeconomic Impact of the Coronavirus: A new perspective… Back in the early phases of the Coronavirus I was optimistically convinced our industry would be driven into a “V” recovery based on the U.S. government’s response. The government did act along the lines of General George S. Patton’s advice that “A good plan, violently executed now is better than a perfect plan tomorrow.” More recently that bright view has darkened as the definition of a pessimist being an optimist with experience became me. The problem is that few, if any, of the plans were violently executed and as John Doerr once said, “Execution is Everything.” However, there has been a lack of execution that has been on multiple levels… Too-small-to-fail: In contrast to the ‘too-big-to-fail’ banking crisis of 2008-10 crisis, this time it’s an amorphous group of small businesses and the many people they hire. The longer businesses are separated from their employees, the longer it will take to restart the economy. So, the ‘V’ anticipated a few months ago is already turning into a ‘U’ and may well become an ‘elongated U.’ An eU would mean the “A good plan, violently executed now is better than a perfect plan tomorrow” — General George S. Patton Contact us to get the full report and more VLSIresearch … intelligence to make better decisions faster Copyright © 2020 VLSI Research Inc. All rights reserved. Distribution rights contained in T&Cs.
semiStockWEEK: VLSI's Semiconductor Stock Indices ended the week mixed while the market slipped. Semiconductors 1%, Equipment -3%, EDA -4%, Electronic Materials 3%. VLSIresearch … intelligence to make better decisions faster Copyright © 2020 VLSI Research Inc. All rights reserved. Distribution rights contained in T&Cs.
Semiconductor Stocks: Weekly Growth and Forward P/E Ratios by Company VLSI’s Semiconductor Stock Index was led up 0.5% by MediaTek, JCET, and Kingpak Technology. IDM +0.7% Foundry & OSAT +3.7% Fabless & Fablite -0.8% Weekly Gains 5/1/2020 Price Change Price Change Semiconductor Stocks Semiconductor Stocks Forward P/E Forward P/E IDM Fab-lite to Fabless Intel Micron -3.0% 2.0% 12 9 AMD Analog Devices -11.2% -2.2% 33 20 ON Semiconductor 10 Broadcom -1.9% 11 3.1% AMD AMDAnalog Devices ADIAmkorAMKR ASE ASXBroadcom AVGOIBMIBM Infineon IFNNY.PK Intel INTCJCET600584.SS Kingpak Technology6238.TWO Micron Technology MU On Semiconductor ONPanasonic PC MagnaChip Semiconductor MXMaxim MXIM MaxLinear MXLMediaTek 2454.TW NVIDIA NVDAQualcomm QCOM Samsung Electronics 005930.KS Silicon Laboratories SLABSkyworks SWKS SMIC SMI STMicroelectronics STM Texas Instruments TXNTSMC TSMUMC UMCWestern Digital WDCXilinx XLNX Samsung Electronics SK hynix IBM Infineon -2.3% 3.8% 10 15 1.3% 2.8% – STMicroelectronics -0.6% 20 MagnaChip Semiconductor -6.7% 12 Western Digital Foundry & OSAT Amkor ASE JCET Kingpak Technology SMIC -0.5% 6 Maxim MaxLinear MediaTek NVIDIA Panasonic Qualcomm Silicon Laboratories -3.0% -2.9% 19.1% -2.4% 5.0% -0.5% 0.6% 24 22 – 31 30 13 28 13 11 79 – 3.4% 1.6% 15.0% 9.4% 5.6% 1482 TSMC UMC -3.1% -5.8% 16 13 Skyworks Texas Instruments Xilinx 14 23 25 2.4% -3.7% -7.5% VLSIresearch … intelligence to make better decisions faster Copyright © 2020 VLSI Research Inc. All rights reserved. Distribution rights contained in T&Cs.
Chip Equipment & Related Stocks: Weekly Growth and Forward P/E Ratios by Company VLSI’s Semiconductor Equipment Stock Index fell 2.6% for the second week in a row, BESI came out on top. WFE -4.1% Test -1.0% Assembly +1.0% Weekly Gains 0 5/1/2020 Price Change Price Change Equipment Stocks Equipment Stocks Forward P/E Forward P/E Wafer Process: Applied Materials ASM International ASML KLA Lam Research Onto Innovation Nikon Test: Advantest Teradyne FormFactor -9.4% -4.8% -4.4% -8.9% -11.9% -5.8% 1.5% 11 17 25 15 13 4.1% -6.7% -0.4% – 16 20 Applied Materials AMAT Advantest ATEYY ASM International ASMI ASM Lithography ASML ASM Pacific 0522.HK BE Semiconductor BESIY.PK FormFactorFORMKLA KLAC Kulicke & Soffa KLIC Lam Research LRCX Onto Innovation ONTONikon 7731 Teradyne TER Tokyo Electron Limited 8035 Veeco VECO Assembly: BESI Kulicke & Soffa 7.5% -8.4% – – – 11 TEL Veeco Instruments ASM Pacific Technology 1.7% 4.9% 3.9% – 12 VLSIresearch … intelligence to make better decisions faster Copyright © 2020 VLSI Research Inc. All rights reserved. Distribution rights contained in T&Cs.
Electronic Materials Stocks: Weekly Growth and Forward P/E Ratios by Company VLSI’s EDA Stock Index plunged 4.0%. Weekly Gains 5/1/2020 VLSI’s Electronics Materials Stock Index was led up 3.1% by DuPont. Price Change Price Change EDA & Electronic Materials Stocks Forward P/E EDA & Electronic Materials Stocks Forward P/E EDA Cadence Synopsys DNP DuPont JSR -1.4% 7.6% 2.1% – 4 – BASF BASFY Cadence CNDS DNP 7912 JSR 4185 SOI.PA Synopsys SNPS Cabot Microelectronics CCMP DuPont DD Shin-Etsu 4063 SOITEC Tokyo Ohka 4186 -5.8% -2.2% 28 25 Electronic Materials BASF Cabot Microelectronics Shin-Etsu SOITEC Tokyo Ohka 1.8% 1.1% 2.3% – – – 2 3.8% 7.2% 16 VLSIresearch … intelligence to make better decisions faster Copyright © 2020 VLSI Research Inc. All rights reserved. Distribution rights contained in T&Cs.
Companies Companies Max Growth Weekly Growth VLSI’s Indices of Chip Industry Stocks Min Growth Range of S&P 500 S&P 500 The Prior Week's Close Growth Growth Down Up Semi Stocks Equipment Stocks Materials Stocks EDA Stocks Semi Stocks Equipment Stocks Materials Stocks EDA Stocks 27-Sep-19 04-Oct-19 11-Oct-19 18-Oct-19 25-Oct-19 01-Nov-19 08-Nov-19 15-Nov-19 22-Nov-19 29-Nov-19 06-Dec-19 13-Dec-19 20-Dec-19 27-Dec-19 03-Jan-20 10-Jan-20 17-Jan-20 24-Jan-20 31-Jan-20 07-Feb-20 14-Feb-20 21-Feb-20 28-Feb-20 06-Mar-20 13-Mar-20 20-Mar-20 27-Mar-20 03-Apr-20 10-Apr-20 17-Apr-20 24-Apr-20 01-May-20 83.6 84.6 86.0 86.2 88.2 90.3 91.7 92.0 90.0 90.9 92.6 96.7 99.2 100.0 100.3 101.5 104.7 106.1 98.4 102.5 106.5 103.7 93.1 91.8 81.1 69.6 78.3 77.1 85.6 89.1 88.7 89.1 83.6 84.4 86.4 86.7 92.4 92.6 94.9 97.0 92.0 93.7 94.7 98.0 99.9 100.0 100.2 100.9 104.8 105.1 98.4 101.3 106.6 99.3 90.4 91.0 78.3 65.2 78.7 73.4 84.0 88.4 86.1 83.9 93.8 93.1 95.0 97.5 100.0 101.2 103.2 101.5 98.7 96.7 95.5 100.0 100.1 100.0 98.9 99.2 101.0 100.5 96.0 100.4 101.0 98.1 85.5 84.8 71.0 67.0 76.6 72.6 82.6 82.7 82.5 85.0 94.7 96.0 96.0 94.5 94.9 94.8 96.1 97.6 95.9 100.1 95.5 96.9 99.6 100.0 100.5 104.7 106.4 107.8 103.8 107.2 114.2 106.4 96.2 95.1 90.7 78.4 88.7 89.9 99.7 111.3 111.9 107.5 -2.1% 1.1% 1.7% 0.2% 2.4% 2.4% 1.5% 0.4% -2.2% 1.0% 1.8% 4.5% 2.6% 0.8% 0.3% 1.2% 3.2% 1.3% -7.3% 4.2% 3.9% -2.6% -10.2% -1.5% -11.6% -14.2% 12.6% -1.6% 11.1% 4.0% -0.4% 0.5% -1.1% 1.1% 2.3% 0.3% 6.6% 0.2% 2.5% 2.1% -5.1% 1.8% 1.1% 3.5% 1.9% 0.1% 0.2% 0.7% 3.9% 0.3% -6.3% 2.9% 5.3% -6.9% -8.9% 0.6% -13.9% -16.7% 20.6% -6.7% 14.5% 5.2% -2.6% -2.6% -0.7% -0.8% 2.0% 2.7% 2.5% 1.3% 1.9% -1.6% -2.8% -2.0% -1.2% 4.7% 0.1% -0.1% -1.1% 0.2% 1.8% -0.5% -4.5% 4.6% 0.6% -2.8% -12.9% -0.7% -16.3% -5.7% 14.4% -5.3% 13.8% 0.2% -0.2% 3.1% -0.4% 1.4% 0.0% -1.5% 0.4% -0.1% 1.3% 1.6% -1.8% 4.4% -4.6% 1.5% 2.7% 0.4% 0.5% 4.2% 1.7% 1.3% -3.8% 3.3% 6.5% -6.9% -9.5% -1.2% -4.6% -13.6% 13.1% 1.4% 10.9% 11.7% 0.6% -4.0% 16 34 35 28 46 36 37 31 7 37 33 48 39 29 23 32 45 29 3 45 47 6 0 18 0 3 52 14 54 41 17 27 3.7% 10.1% 9.0% 11.2% 15.6% 9.9% 12.5% 10.8% 5.7% 5.0% 8.2% 10.7% 12.5% 5.9% 9.5% 7.2% 19.1% 14.9% 2.2% 21.4% 27.5% 4.5% -0.8% 7.9% -2.1% 15.3% 36.1% 17.4% 38.2% 17.0% 9.2% 19.1% -37 -20 -15 -23 -7 -15 -14 -20 -44 -14 -19 -3 -13 -23 -24 -22 -10 -25 -51 -10 -8 -49 -55 -35 -55 -52 -3 -41 -1 -10 -37 -28 -12.1% -3.5% -4.4% -6.0% -16.3% -12.1% -4.2% -5.0% -17.7% -15.0% -4.8% -1.4% -8.4% 2.7% -3.4% -4.8% -3.8% -10.8% -17.7% -11.7% -10.0% -17.1% -21.3% -11.0% -26.6% -28.9% -11.7% -15.1% -2.3% -6.1% -9.8% -11.9% 15.8% 13.6% 13.4% 17.2% 31.9% 22.0% 16.7% 15.8% 23.4% 20.0% 13.0% 12.1% 20.9% 8.6% 12.9% 12.0% 22.9% 25.7% 19.9% 33.1% 37.5% 21.6% 20.5% 18.9% 24.5% 44.2% 47.8% 32.5% 40.5% 23.1% 19.0% 31.0% 91.4 91.1 91.7 92.2 93.3 94.7 95.5 96.3 96.0 96.9 97.1 97.8 99.4 100.0 99.8 100.8 102.8 101.7 99.5 102.7 104.3 103.0 91.2 91.7 83.7 71.1 78.4 76.8 86.1 88.7 87.6 87.4 -1.0% -0.3% 0.6% 0.5% 1.2% 1.5% 0.9% 0.9% -0.3% 1.0% 0.2% 0.7% 1.7% 0.6% -0.2% 0.9% 2.0% -1.0% -2.1% 3.2% 1.6% -1.3% -11.5% 0.6% -8.8% -15.0% 10.3% -2.1% 12.1% 3.0% -1.3% -0.2% VLSIresearch … intelligence to make better decisions faster Copyright © 2020 VLSI Research Inc. All rights reserved. Distribution rights contained in T&Cs.