Download
1 / 14
140 likes | 283 Views
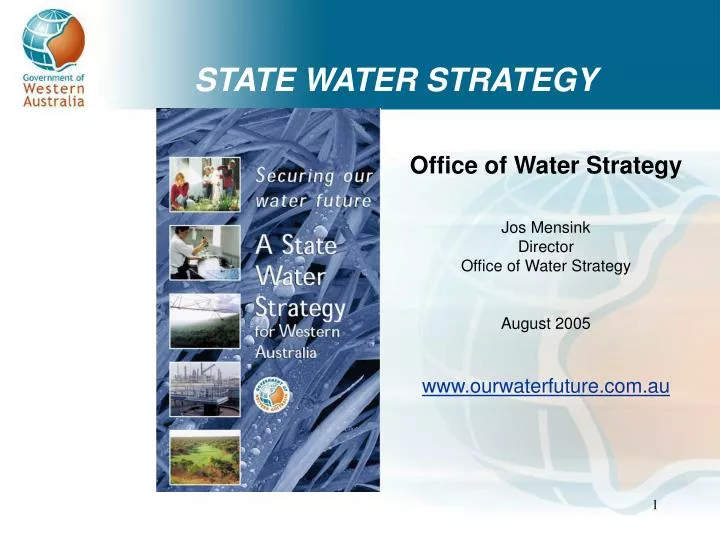
STATE WATER STRATEGY. Office of Water Strategy Jos Mensink Director Office of Water Strategy August 2005 www.ourwaterfuture.com.au. S hort H istory of State Water Supplies. Runoff to Hills dams in 2001 only 30% of 25 year average - a bout 40 GL compared to average of 180 GL.

E N D
STATE WATER STRATEGY Office of Water Strategy Jos MensinkDirectorOffice of Water Strategy August 2005 www.ourwaterfuture.com.au
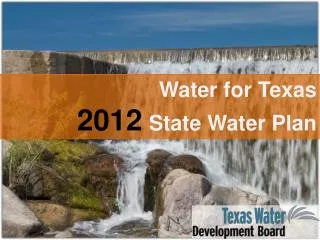
Short History of State Water Supplies • Runoff to Hills dams in 2001 only 30% of 25 year average -about 40 GL compared to average of 180 GL. • Inflow in 2002 only slightly better with about 90 GL.Combined inflow for those two years is the worst on record. • Water becomes one of top three community issues and Government established the Water Taskforce. • 19Water forums held in 2002 (9 metro area, 10 regional) and Parliament House Symposiumin October 2002 to build framework for the State Water Strategy. • State Water Strategy released February 2003. • 2003 runoff was about 150 GL.
2001, 36% less Rainfall 21% less 14% less Percentage changes are relative to 1911-1974 period Streamflow 2001, 88% less 64% less 52% less
Last quarter century winter rain as % of previous 75 years Decrease A drier and warmer climate for the SW Informed adaptation to climate change
Water Resources Portfolio Water Resources Cabinet Sub Committee Chair: Premier Senior Steering Group (DPC, WC, DoE, DTF) State Water Council Chair: D Hatt - Office of Water Strategy - Senior representatives from Government Agencies - Water Service Providers - Ministerial Advisors Minister Assisting in Water Resources Hon J Kobelke Minister for Water Resources Premier Department of the Premier and Cabinet – Policy Division Office of Water StrategyStrategic Policy and Planning J Mensink (Director) Water Utilities - Water Corporation - Busselton Water - AQWEST Bunbury New Water Resources Entity by 1/9/2005 (Option)
Roles • The Office of Water Strategyprovides high level advice to the Government in relation to water strategy and facilitation and coordinates Government activity including new water source developoment, demand management and water reuse. It also provides support to the Premier‘s Water Foundation and other Committees involved in the implementation of the State Water Strategy. • The Government’s preferred option for longer-term administrative support for the Water Resources Portfolio should be substantially progressed by September 2005. • The State Water Council consists of nominated senior representatives from government agencies, ministerial advisers and water utilities. The Council acts as a forum on water related matters and provides advice to the Water Resources Cabinet Sub-Committee.
Gnangara Mound
Identified potential GDEs not previously considered based on depth to groundwater mapping of Gnangara Mound. • Gnangara • >400 wetlands • 33 Bush Forever Sites supporting areas of phreatophytic terrestrial vegetation • 6 mound springs • 4 caves • near shore marine systems. • Identified ecological values of new GDEs • Outlined changes in ecological condition (where assessed)
Climate 2 Decline predictions @ 2015 28 year Monthly Median 8 year Monthly Median
Future abstraction for public water supply • Demand: assume the 155 KL/person demand target is met by 2012 • New sources: • 45 GL/yr Perth Seawater Desalination Plant by late 2006 • 17 GL/yr water trade by 2008/09 • 45 GL/yr South West Yarragadee by late 2009 • Drought security: ~0.5% chance of a total ban on sprinklers • Groundwater abstraction: • Gnangara groundwater is critical – a variable allocation between 105 and 165 GL/yr depending upon storage in dams will secure the IWSS
Gnangara Mound Aquifers • The Gnangara Mound covers more than 2,000 km2
Contact details For more information visit our website: www.ourwaterfuture.com.au • Contact details:Office of Water Strategy Policy DivisionDepartment of the Premier & CabinetL26,197 St George’s Terrace, Perth WA 6000Ph (08) 9222 9832, Fax (08) 9222 9509jmensink@dpc.wa.gov.au