Download
1 / 23
230 likes | 390 Views
Estimating Ethnic Mortality. Pia Wohland. ESRC Research Award RES-165-25-0032, 01.10.2007- 30.09.2009 What happens when international migrants settle? Ethnic group population trends and projections for UK local areas. Mortality input data for.

E N D
Estimating Ethnic Mortality • Pia Wohland ESRC Research Award RES-165-25-0032, 01.10.2007- 30.09.2009 What happens when international migrants settle? Ethnic group population trends and projections for UK local areas
Mortality input data for Ethnic projection model by local areas (LA) of the UK UK: England 16 ethnic groups 352 LA Wales 16ethnic groups 22 LA Scotland 5 ethnic groups 32 LA Northern Ireland 12 ethnic groups 26 LA Survival probability for ethnic groups in 432 local areas of the UK, by SYA age and 2 gender
We have..... • Ethnic population estimates and projections in the UK • BUT • No ethnic specific mortality • Except: • Longitudinal Study • ONS ethnic group infant mortality (2008)
Is ethnic group mortality of importance? Arias E. United States life tables, 2004. National vital statistics reports; vol 56 no 9. Hyattsville, MD: National Center for Health Statistics. 2007. United States New Zealand Ajwani S, Blakely T, Robson B, Tobias M, Bonne M. 2003. Decades of Disparity: Ethnic mortality trends in New Zealand 1980-1999. Wellington: Ministry of Health and University of Otago.
Surrogate data? (Burström and Friedlund 2001, McGee et al. (1999) Heistaro et al. (2001) Helwig-Larson et al. (2003) Franks et al. (2003) , Singh and Siahpush (2001) • The relationship for men is different from that for women. • Socioeconomic factors are important in explaining mortality variation across groups but self-reported health status still has a significant influence after controlling for them. • There is variation between racial/ethnic groups in the self-reported health-mortality link but it is not huge. • There is an important influence of immigrant generation with the first generation having better self-reported health and mortality than subsequent generations. Self-reported health - a strong predictor of subsequent mortality.
Census 2001 Question Available for local areas, ethnic groups and age groups
All Person Residents data All Person Limiting long term illness data ALL PERSONDEATHS DATA POPULATION DATA 2001 Mid year Estimates Countries & Local Authorities 2001 Census Tables S16,S65 Countries & Local Authorities 2001 Vital statistics Countries & Local Authorities 2001 Census Tables S16,S65 Countries & Local Authorities All Person Standardised Illness Ratios (SIR) 2001 , UK Standard Countries & Local Authorities All Person Standardised Mortality ratios (SMR) REGRESSION ANALYSIS 2001, UK Standard Countries & Local Authorities SMR = f(SIR) Residents data by ethnicity Standardised Mortality ratios by ethnicity Standardised illness ratios by ethnicity (SIR) 2001 Census Tables ST 101, 107, 207, 318 Countries & Local Authorities 2001, UK Standard Countries & Local Authorities 2001, UK Standard Countries & Local Authorities Limiting long term illness by ethnicity Life Tables & Survivorship Probabilities by ethnicity 2001 Census Tables ST 101, 107, 207, 318 Countries & Local Authorities 2001 (Calendar Year) Countries & Local Authorities
Method 1Using illness data from the census Step 1 compute life tables for all UK LAs: mortality rates
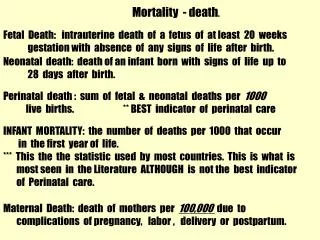
Standardisation = Observed data / Excepted data Standardised mortality ratio (SMR) Standard population UK UK population mortality rates illness rates
All group SMR as a function of SIRDifferences between home countries? ♀ ♂
England all group SMR as a function of SIR:High ethnic minority versus low ethnic minority LAs ♀ ♂
England all group SMR as a function of SIR:North versus South ♂ http://img.dailymail.co.uk/i/pix/2007/10_04/england2410_468x816.jpg
Small number issue ♀ = above threshold threshold = 10 ill, 100 population = below threshold = need model replacement
SMRs for White British Males Results: SMRs SMRs for Indian Males SMRS for all groups SMRs for Chinese males SMRs for Bangladeshi Males
From SMR to mortality rates Estimate mortality rates by age and sex for ethnic groups from estimated SMRs: Miexg = Mixg × SMRi eg / 100 We assume each ethnic group has the same mortality pattern by age Adjust the estimated mortality rates so that they agree with the all group mortality rates.
The ranking of mean life expectancy for ethnic groups, men and women, England, 2001
Spatial distribution of life expectancies at birth 2001(1) ♀ ≥81.2 to <85.9 ≥78.9 to <81.2 ≥73.8 to <78.9
Spatial distribution of life expectancies at birth 2001(2) ≥81.2 to <85.9 ≥78.9 to <81.2 ≥73.8 to <78.9
Spatial distribution of life expectancies at birth 2001 (3) ♂ ≥77.2 to <84.6 ≥74.5 to < 77.2 ≥68.7 to < 74.5 Pakistani and other South Asian
Comparison with an alternative method Method of choice Alternative: geographically weighted England ♂ England ♀ Alternative: geographically weighted Method of choice