Download
1 / 15
150 likes | 308 Views
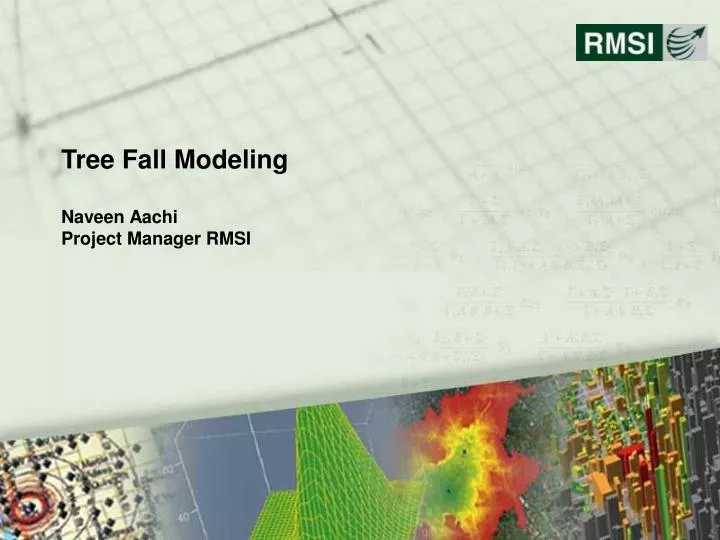
Tree Fall Modeling Naveen Aachi Project Manager RMSI. Agenda. Overview Objective Inputs Methodology Results. OVERVIEW. Hurricane and High wind seasons cause extensive damage to properties. Strong winds uproot trees disturbing power lines, damaging roofs, garages and other utilities.

E N D
Agenda • Overview • Objective • Inputs • Methodology • Results
OVERVIEW Hurricane and High wind seasons cause extensive damage to properties. Strong winds uproot trees disturbing power lines, damaging roofs, garages and other utilities. RMSI did a research project for an insurance company in the US. Claims during 2006-07 season for damages due to tree falls – significantly higher for single family dwellings. To assess the risks from the tree falls, information on the tree coverage within residential areas is required. Mapping this kind of a data through conventional methods is an expensive approach. RMSI worked out a cost effective solution by developing a county wise mapping of percentage tree cover for assessment of exposure.
OBJECTIVE To calculate Tree Canopy Area within Single Family Residential Area for all Counties of US.
INPUTS Land Cover Grid (NLCD) Tree Canopy Grid US County Shape files NLCD – Land cover data Tree Canopy Data
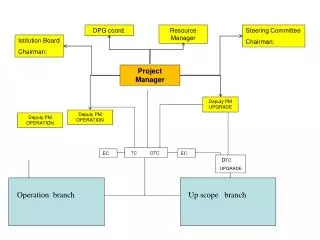
METHODOLOGY Process Flow Chart
METHODOLOGY The tree canopy data present in Image formats in different zones covering entire US were downloaded from the “www.mrlc.gov” site and exported to grid format.
METHODOLOGY From NLCD data, classes 22 and 23 belonging to single family residential areas were extracted and reclassified to a single class. Tree Canopy data corresponding to the residential area was extracted.
METHODOLOGY Insets for Residential classes and Tree canopy
METHODOLOGY US counties data were projected to the base projection of NLCD and tree canopy data, which is Albers equal area. State wise counties data was processed and tree canopy areas calculated using the tabulate areas option.
METHODOLOGY Tree Canopy Area Calculation Each class (values from 1 to 100) represents the percentage area distribution of tree canopy area. Example: If the canopy class (value) 1 falls in the tabulated area, it represents 30m X30m = 900 sqm of area ( as resolution of the grid is 30m) but canopy coverage area will be 1% of 900 sqm i.e 9 sqm . Likewise for class 50 it represents the 50% of 900sqm i.e 450 sqm and for class 100 it will be 900sqm The extracted area has been summed to get the tree canopy area with respect to SFR area for each county.
METHODOLOGY Percentage Tree Cover within Single Family Residential Area