Download
1 / 64
660 likes | 684 Views
malnutrion is very common in developing country; so knowing causes,clinical presentation,diagnosis and treatment is very important for health personel

E N D
Malnutrition By reshid 2021
Nutrition, Food Security, and Health • Undernutrition is usually an outcome of three factors, often in combination: • Household food supply, • Childcare practices, and • Access to health and water/sanitation services. • In famine and emergency settings, food shortage is the foremost factor, but in many countries with widespread undernutrition, food production or access to food might not be the most limiting factor.
Nutrition, Food Security, and Health • More important causes might be • Repeated childhood infections(diarrheal diseases) associated with • An unsafe environment and lack of exclusive breastfeeding, or • Inadequate complementary feeding practices, or • The lack of time families have available for appropriate infant or maternal care. • Inequitable distribution of resources because of • Political, • Economic, and • Agricultural policies often denies families their right to adequate • land, water, food, • healthcare, education, and • a safe environment
Nutrition, Food Security, and Health • Risk factor for undernutrion • Chronically ill patients in neonatal and pediatric intensive care units • Burns, • Human immunodeficiency virus (HIV) infection, • Tuberculosis, • Cystic fibrosis, • Chronic diarrhea syndromes, • Malignancies, • Bone marrow transplantation • Inborn errors of metabolism. • Fad diets, • Infants with food allergies fed nutritionally inadequate foods such as rice “milk,” which has a very low protein and micronutrient content
Food Security • Exists when all people, at all times, have access to sufficient, safe, nutritious food to maintain a healthy and active life. • Dimensions of food security can be identified: • Availability:Level of food production • Access: purchasing power • Utilization: shared equitably within a household. • Stability: being “food secure” at all times: • To be food secure, all four dimensions must be met simultaneously.
Measuring Food Insecurity • The most commonly used measurement of food insecurity is undernourishment (chronic hunger), which is the proportion of the population who are unable to meet daily energy requirements for light activities. • It is an estimate calculated by the Food and Agriculture Organization (FAO) based on country-level food balance sheets. • It does not take nutrient adequacy into account, but has the advantage of being available for almost all countries annually (although with a time lag) and assists in monitoring global trends. • In addition, FAO measures food access by asking individuals about their experiences over the last 12 mo, such as whether they ran out of food or skipped meals. • The responses are graded from mild to severe food insecurity.
Measuring Food Insecurity • This relatively simple monitoring tool, the Food Insecurity Experience Scale , provides timely information to guide decision-making at national and local levels. • In 2017, FAO estimated that about 821 million people, or 10.9% of the world's population, were undernourished, 98% of whom were in developing countries. • The majority are rural poor people subsisting on small plots of land or hired as laborers, and urban poor people who lack the means to grow or buy food. • Alongside the 0.82 billion people who are underfed are 1.9 billion who are overfed, reflecting global inequalities and the “double burden of malnutrition” in low- and middle-income countries.
Nutrition, Food Security, and Poverty • Household food security tracks income closely. • With rising incomes, very poor households first increase their dietary energy intake to avert hunger. • If incomes rise further, there is a shift to more expensive staple foods and then to a more varied diet with a greater proportion of energy from animal sources, fruits/vegetables, and fats/sugars, and less from cereals, roots, and tubers. • National economic growth tends to be accompanied by reductions in stunting, but economic growth can pass by poor persons if they work in unaffected sectors, or are unable to take advantage of new opportunities because of lack of education, access to credit, or transportation, or if governments do not channel resources accruing from economic growth to healthcare, education, social protection, and other public services and infrastructure. • There is good evidence that economic growth reduces poverty but does not necessarily reduce undernutrition.
Food Security and Nutrition Targets • All developing regions except sub-Saharan Africa achieved the target to halve the proportion of people living in extreme poverty, with the proportion falling from 47% in 1990 to 14% in 2015. • Reductions in hunger were broadly consistent with those of poverty reduction, and rates of undernourishment in developing regions fell from 23% in 1990 to 13% in 2015. • The prevalence of underweight children (another MDG indicator of “hunger”) fell from 29% in 1990 to 15% in 2015 for the developing regions combined. • Rural children are almost twice as likely to be underweight as urban children, and the poorest quintile is almost 3 times as likely to be underweight as the richest quintile. • Eradicating poverty and hunger continue to be core targets of the Sustainable Development Goals , as agreed by 193 countries of the United Nations General Assembly in September 2015, and are to be achieved by 2030. • In addition, in 2012 the World Health Assembly agreed to 6 global nutrition targets to be reached by 2025, measured against a 2010 baseline, and the United Nations Secretary-General launched the Zero Hunger Challenge with 5 objectives that “would boost economic growth, reduce poverty and safeguard the environment” and “would foster peace and stability”
Future Food Security • Between now and 2050 the world's population is expected to exceed 9 billion, and an increase in food supply of 70–100% will be needed to feed this larger, more urban, and more affluent populace. • Over this same period, the world's food supply is expected to diminish unless action is taken. • Accelerating the decline in fertility rates and reducing overconsumption are basic but difficult actions to bridge the gap between increasing demand and diminishing supply. • Equallychallenging actions include • limiting climate disruption, • increasing the efficiency of food production, • reducing waste, and • reducing the demand for meat and dairy Foods
Future Food Security ◆ Limit climate disruption. • Drought, floods, and other extreme weather events are becoming more prevalent and destroy crops and livestock, often on a huge scale. • Rising sea levels will lead to loss of productive land through inundation and salinization. • Acidification of oceans will reduce marine harvests. • Because curbing greenhouse gas emissions is essential to minimize climate disruption, the goals are • (1) to cut fossil fuel use by at least half of present levels by 2050 so as to reduce carbon dioxide (CO2 ) emissions and • (2) change livestock husbandry and agronomic practices to reduce methane and nitrous oxide (N2 O) emissions.
Future Food Security ◆ Increase efficiency of food production. • Expanding the area of agricultural land to any large extent (e.g., by deforestation) is not a sustainable option because of adverse consequences on ecosystems and biodiversity, although some expansion of food production could be achieved by switching good quality land away from first-generation biofuels. • For example, almost 40% of the U.S. corn harvest in 2016–2017 went to biofuels. • Efforts to increase the intensity of production need to be environmentally sustainable. • These include optimizing yields by soil and water conservation, removal of technical and financial constraints faced by farmers, and breeding resource-efficient crops and livestock that are also climate resilient and pest/disease resistant.
Future Food Security • ◆ Reduce waste. • From 30–40% of food is wasted, between harvesting and the market, during retail, at home, and in the food service industry. • Better transport and storage facilities in developing countries, less stringent sell-by dates, lower cosmetic standards for fruits and vegetables, and ending supersized portions would help reduce waste. • ◆ Change diets. • As wealth increases, so does the demand for processed foods, meat, dairy products, and fish. • About one third of global cereal production is fed to animals, so reducing consumption of meat from grain-fed livestock and increasing the proportion derived from the most efficient sources (pigs and poultry) would allow more people to be fed from the same amount of land.
Under nutrition • The greatest risk of under nutrition (underweight, stunting, wasting, and micronutrient deficiencies) occurs in the first 1000 days, from conception to 24 mo of age, and this early damage to growth and development can have adverse consequences in later life on • Health, • Intellectual ability, • School achievement, • Work productivity, and • Earnings.
Measurement of Undernutrition • Many poor nutritional outcomes begin in utero and are manifest as • low birthweight (BW <2,500 g). • Preterm delivery and fetal growth restriction are the 2 main causes of LBW, with • prematurity …richer countries and • fetal growth restriction ….In poorer countries. • International standards of normal child growth under optimum conditions from birth to 5 yr have been established by the World Health Organization (WHO).
Measurement of Undernutrition • To compile the standards, longitudinal data from birth to 24 mo of healthy, breastfed, term infants were combined with cross-sectional measurements of children ages 18-71 mo. • The standards allow normalization of anthropometric measures in terms of z scores (standard deviation [SD] scores). • A z-score is the child's height (weight) minus the median height (weight) for the child's age and sex divided by the relevant SD. • The standards are applicable to all children everywhere, having been derived from a large, multicountry study reflecting diverse ethnic backgrounds and cultural settings.
SAM • Height-for-age (or length-for-age for children <2 yr) is a measure of linear growth, and a deficit represents the cumulative impact of adverse events, usually in the first 1000 days from conception, that result in stunting, or chronic malnutrition. • A low height-for-age typically reflects socioeconomic disadvantage. • A low weight-for-height , or wasting , usually indicates acute malnutrition. • Conversely, a high weight-for-height indicates overweight . • Weight-for-age is the most commonly used index of nutritional status, although a low value has limited clinical significance because it does not differentiate between wasting and stunting. • Weight-for-age has the advantage of being somewhat easier to measure than indices that require height measurements. • In humanitarian emergencies and some community or outpatient settings, midupper arm circumference is used for screening wasted children
SAM • Body mass index (BMI) is calculated by dividing weight in kilograms by the square of height in meters. • For children, BMI is age and gender specific. • BMI for-age can be used from birth to 20 yrand is a screening tool for thinness (less than −2 SD), overweight (between +1 SD and +2 SD), and obesity (greater than +2 SD). • To diagnose obesity, additional measures of adiposity are desirable because a high BMI can result from high muscularity, and not only from excess subcutaneous fat. • Micronutrient deficiencies are another dimension of undernutrition. • Those of particular public health significance are vitamin A, iodine, iron, and zinc deficiencies
SAM • Vitamin A deficiency is caused by a low intake of retinol (in animal foods) or its carotenoid precursors, mainly beta carotene (in orange-colored fruits and vegetables and dark-green leaves) . • The prevalence of clinical deficiency is assessed from symptoms and signs of xerophthalmia (principally night blindness and Bitot spots). • Subclinical deficiency is defined as serum retinol concentration ≤0.70 µmol/L. • Vitamin A deficiency is the leading cause of preventable blindness in children. • It is also associated with a higher morbidity and mortality among young children.
SAM • Iodine deficiency is the main cause of preventable intellectual impairment • An enlarged thyroid (goiter) is a sign of deficiency. • Severe deficiency in pregnancy causes fetal loss and permanent damage to the brain and central nervous system in surviving offspring (cretinism). • It can be prevented by iodine supplementation before conception or during the 1st trimester of pregnancy. • Postnatal iodine deficiency is associated with impaired mental function and growth retardation. • The median urinary iodine concentration in children age 6-12 yr is used to assess the prevalence of deficiency in the general population, and a median of <100 µg/L indicates insufficient iodine intake.
SAM • Iron-deficiency anemia is common in childhood either from low iron intakes or poor absorption, or as a result of illness or parasite infestation • Women also have relatively high rates of anemia as a result of menstrual blood loss, pregnancy, low iron intake, poor absorption, and illness. • Hemoglobincutoffs to define anemia are 110 g/L for children 6-59 mo, 115 g/L for children 5-11 yr, and 120 g/L for children 12-14 yr. • Cutoffs to define anemia for nonpregnant women are 120 g/L, 110 g/L for pregnant women, and 130 g/L for men. • Zinc deficiency increases the risk of morbidity and mortality from diarrhea, pneumonia, and possibly other infectious diseases • Zinc deficiency also has an adverse effect on linear growth. Deficiency at the population level is assessed from dietary zinc intakes or serum zinc concentrations
Prevalence of Undernutrition • It is estimated that approximately 16% of births worldwide in 2013 were LBW. • Rates of LBW are highest (28%) in southern Asia, which are twice those of subSaharan Africa. • Globally, in 2015, 14% of children <5 yr of age were underweight (weight-for-age < −2 SD). • The global prevalence of stuntin g (height-for-age < −2 SD) has declined from 33% in 2000 to 22% in 2017, with the greatest reductions occurring in Asia. • Stunting prevalence is highest in the African region (30%). • Wasting (weight-for-height < −2 SD) affects 7% of children <5 yr, with minimal change in prevalence over the past 2 decades. • These figures represent 151 million stunted children, and 51 million wasted children.
Prevalence of Undernutrition • In 2017, 55% of all stunted children and 69% of all wasted children lived in Asia. • Africa carries most of the remaining global burden. • For children <5 yr, the global prevalence is estimated to be 33% for vitamin A deficiency, 29% for iodine deficiency, 17% for zinc deficiency, and 18% for iron-deficiency anemia . • Prevalence of micronutrient deficiencies tends to be highest in Africa. • For pregnant women, the estimated prevalence of vitamin A deficiency is 15% and for iron-deficiency anemia, 19%. • Rates of clinical deficiency of vitamin A in children <5 yr have been declining, probably as a result of high-dose vitamin A supplementation programs and measles vaccination (because measles leads to sizable urinary loss of vitamin A), but subclinical deficiency remains widespread (>90 million children). • Large-scale availability of iodized salt has reduced rates of iodine deficiency substantially, and iodized salt reaches an estimated 75% of households. • In contrast, progress in reducing rates of iron-deficiency anemia is slow, and rates remain largely static.
Consequences of Undernutrition • premature death • Fetal growth restriction together with suboptimal breastfeeding in the 1st month of life contribute to 19% of all deaths in children <5 yr (1.3 million deaths/yr). • When the effects of stunting, wasting, and deficiencies of vitamin A and zinc are also considered, these 6 items jointly contribute to 45% of global child deaths (3.1 million deaths/yr), and many more are disabled or stunted for life. • Anemia contributes to over one quarter of maternal deaths.
Global Deaths in Children <5 yr Attributed to Nutritional Conditions
Consequense • The risk of child death from infectious diseases increases even with mild undernutrition, and as the severity of undernutrition increases, the risk increases exponentially • Undernutrition impairs immune function and other host defenses; consequently, childhood infections are more severe and longer lasting in undernourished children and more likely to be fatal than the same illnesses in well-nourished children. • Infections can adversely affect nutritional status, and young children can quickly enter a cycle of repeated infections and ever-worsening malnutrition. • Even for the survivors, physical and cognitive damage as a result of undernutrition can impact their future health and economic well-being. • For girls, the cycle of undernutritionis passed on to the next generation when undernourished women give birth to LBW babies.
consequence • LBW is associated with an increased risk of hypertension, stroke, and type 2 diabetes in adults. • The increased risk is thought to reflect “fetal programming,” a process by which fetal undernutrition leads to permanent changes in the structure and metabolism of organs and systems that manifest as disease in later life. • The risk is exacerbated by low weight gain during the first 2 yr of life. • The increased risk of adult chronic disease from undernutrition early in life is a particular challenge to low-income countries with rapid economic growth. • Stunting before age 3 yr is associated with poorer motor and cognitive development and altered behavior in later years. • The effect is 6-13 DQ (developmental quotient) points. • Iodine and iron deficiencies also lead to loss of cognitive potential. • Indications are that children living in areas of chronic iodine deficiency have an average reduction in IQ (intelligence quotient) of 12-13.5 points compared with children in iodine-sufficient areas. • Iron deficiency has a detrimental effect on the motor development of children <4 yr and on cognition of school-age children. • The estimated deficit is 1.73 IQ points for each 10 g/L decrease in hemoglobin concentration.
The consequences can be quantified in 5 categories: • (1) increased costs of healthcare, either neonatal care for LBW babies or treatment of illness for infants and young children; • (2) productivity losses (and thus reduced earnings) associated with smaller stature and muscle mass; • (3) productivity losses from reduced cognitive ability and poorer school performance; • (4) increased costs of chronic diseases associated with fetal and early child malnutrition; and • (5) consequences of maternal undernutrition on future generations. • The impact of nutrition on earnings appears to be independent of the effects of childhood deprivation.
Key Interventions • address immediate causes (nutrition-specific interventions ) and those that address underlying causes (nutrition-sensitive interventions ). • nutrition-specific interventions (e.g., salt iodization) can have substantial impact even in the absence of economic growth, and micronutrient interventions (supplementation and fortification) are consistently ranked as the most cost-effective investment. • There is increased attention to nutrition-sensitive interventions as the best means of sustainably eliminating malnutrition, and to multisectoral policies that harness the synergism between the two types of intervention (e.g., cross-sectoral linkages among agriculture, nutrition, and health).
To reduce the adverse consequences of undernutrition on mortality, morbidity, and cognitive development, interventions must encompass both fetal and postnatal periods. • Preventing LBW is essential, with emphasis on prevention of low maternal BMI and anemia, and in the longer term, prevention of low maternal stature. • Other measures include smoking cessation, birth spacing, delaying pregnancy until after 18 yr of age, and intermittent preventive treatment of malaria. • In the postnatal period, promotion and support of exclusive breastfeeding is a high priority. • Although the Baby Friendly Hospital Initiative has a marked benefit on rates of exclusive breastfeeding in hospital, postnatal counseling from community workers or volunteers is needed to facilitate continuation of exclusive breastfeeding at home for 6 mo • Most studies show a lower risk of HIV transmission with exclusive breastfeeding than with mixed breastfeeding. • The risk of HIV transmission by breastfeeding is approximately 5–20%, depending on duration, but can be reduced to <2% with antiretroviral drugs. • Even without antiretroviral drugs, exclusively breastfed children of HIV-infected mothers in low-income countries have lower mortality than non-breastfed children, because the latter are at increased risk of death from diarrhea and pneumonia.
Interventions to improve infant feeding must be designed for the local setting and thus require careful formative research during their development. • Messagesshould be few, feasible, and culturally appropriate. • For complementary feeding, nutrient-rich energy-dense mixtures of foods and responsive feeding are often emphasized. • Where adequate complementary feeding is difficult to achieve and subclinical deficiencies are common, high-dose vitamin A supplementation every 6 mo in children 6-59 mo of age reduces all-cause mortality and death due to diarrhea by 12%, and zinc supplementation can reduce 1-4 yr mortality by 18%, diarrhea incidence by 13%, and pneumonia by 19%. • Monitoring of child growth provides an early alert to a nutrition or health problem but is only worthwhile if accompanied by good counseling and growth promotion activities. • The impact of growth monitoring and promotion will depend on coverage, intensity of contact, health worker performance and communication skills, adequacy of resources, and the motivation and ability of families to follow agreed actions.
Severe Acute Malnutrition • is defined as severe wasting and/or bilateral edema. • Severe wasting is extreme thinness diagnosed by a weight-for-length (or height) < −3 SD of the WHO Child Growth Standards. • Amid-upper arm circumference <115 mm (6 mos-6yrs)also denotes extreme thinness: • Bilateral edema is diagnosed by grasping both feet, placing a thumb on top of each, and pressing gently but firmly for 10 sec. • A pit (dent) remaining under each thumb indicates bilateral edema. • This definition of severe acute malnutrition distinguishes wasted/edematous children from those who are stunted, since stunted children (although underweight) are not a priority for acute clinical care because their deficits in height and weight cannot be corrected in the short term. • The previous name protein-energy malnutrition is avoided because it oversimplifies the complex, multideficiency etiology. • Other terms are marasmus (severe wasting), kwashiorkor (characterized by edema), and marasmic-kwashiorkor (severe wasting and edema).
Clinical Manifestations and Treatment of Undernutrition • Infections can lead to profound nutrient deficits and imbalances: For example, amino acids are diverted to form acute-phase proteins, and potassium, magnesium, vitamin A, and zinc are lost through diarrhea, and losses of glycine and taurine are linked to small bowel bacterial overgrowth. • Ingested microbes can cause villous atrophy and loss of nutrients from maldigestion and malabsorption, as well as disruption of gut barrier function leading to microbial translocation, chronic immune activation, and altered gut microbiome(environmental enteric dysfunction). • Deficits can also arise from increased nutrient utilization in response to noxae (e.g., cysteine and methionine to detoxify dietary cyanogens).
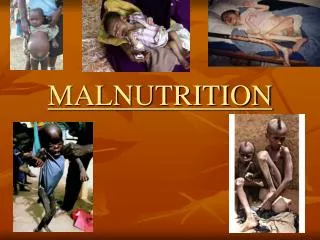
Heterogeneity in the extent and nature of the deficits and imbalances, reflecting the diverse pathways to severe acute malnutrition, helps explain why affected children differ in their clinical presentation and degree of metabolic disturbance. • Children who develop edematous malnutrition are more likely than nonedematous children to have been exposed to noxae that generate oxidative stress and/or to have greater deficits in free radical–scavenging antioxidants (glutathione, vitamins A, C, and E, and essential fatty acids) or cofactors (zinc, copper, selenium). • Severe wasting is most visible on the thighs, buttocks, and upper arms, as well as over the ribs and scapulae, where loss of fat and skeletal muscle is greatest • Wasting is preceded by failure to gain weight and then by weight loss.
The skin loses turgor and becomes loose as subcutaneous tissues are broken down to provide energy. • The face may retain a relatively normal appearance, but eventually becomes wasted and wizened. • The eyes may be sunken from loss of retro-orbital fat, and lacrimal and salivary glands may atrophy, leading to lack of tears and a dry mouth. • Weakened abdominal muscles and gas from bacterial overgrowth of the upper gut may lead to a distended abdomen. • Severely wasted children are often fretful and irritable.
Clinical manfestation of sam • In edematous malnutrition the edema is most likely to appear first in the feet and then in the lower legs. • It can quickly develop into generalized edema affecting also the hands, arms, and face. • Skin changes typically occur over the swollen limbs and include dark, crackled peeling patches (“flaky paint” dermatosis) with pale skin underneath that is easily infected • The hair is sparse and easily pulled out and may lose its curl. • In dark-haired children the hair may turn pale or reddish. • The liver is often enlarged with fat. • Children with edema are miserable and apathetic, and often refuse to eat.
Pathophysiology • When a child's intake is insufficient to meet daily needs, physiologic and metabolic changes take place in an orderly progression to conserve energy and prolong life. • This process is called reductive adaptation . • Fat stores are mobilized to provide energy. • Later, protein in muscle, skin, and the gastrointestinal tract is mobilized. • Energy is conserved by reducing physical activity and growth, reducing basal metabolism and the functional reserve of organs, and reducing inflammatory and immune responses. • These changes have important consequences: • ◆ Heat production is less, making the child more vulnerable to hypothermia.
Pathophysiology • The kidneys are less able to excrete excess fluid and sodium, and fluid easily accumulates in the circulation, increasing the risk of fluid overload. • The heart is smaller and weaker and has a reduced output, and fluid overload readily leads to death from cardiac failure. • Sodium builds up inside cells due to leaky cell membranes and reduced activity of the sodium potassium pump, leading to excess body sodium, fluid retention, and edema. • Potassium leaks out of cells and is excreted in urine, contributing to electrolyte imbalance, fluid retention, edema, and anorexia.
Pathophysiology • Loss of muscle protein is accompanied by loss of potassium, magnesium, zinc, and copper. • The gut produces less gastric acid and enzymes. • Motility is reduced, and bacteria may colonize the stomach and small intestine, damaging the mucosa and deconjugating bile salts. Digestion and absorption are impaired. • Cell replication and repair are reduced, increasing the risk of bacterial translocation through the gut mucosa. • Immune function is impaired, especially cell mediated immunity. The usual responses to infection may be absent, even in severe illness, increasing the risk of undiagnosed infection. • Red blood cell mass is reduced, releasing iron, which requires glucose and amino acids to be converted to ferritin, increasing the risk of hypoglycemia and amino acid imbalances. • If conversion to ferritin is incomplete, unbound iron promotes pathogen growth and formation of free radicals. • Micronutrient deficiencies limit the body's ability to deactivate free radicals, which cause cell damage. • Edema and hair/skin changes are outward signs of cell damage.
Malnutrition • Failure to thrive (FTT) has classically been the term used to describe children who are not growing as expected. • Malnutrition refers to undernutrition and is defined as an imbalance between nutrient requirements and intake or delivery that then results in deficits—of energy, protein, or micronutrients—that may negatively affect growth and development. • Illness-related malnutrition may be caused by one or more diseases, infections, or congenital anomalies, as well as by injury or surgery. • Non–illness-related causes include environmental, psychosocial, or behavioral factors. • Often, one cause may be primary and exacerbated by another. • Patients with malnutrition may present with • Growth deceleration, • Faltering growth, or • Weight loss, as measured by anthropometric parameters • Weight, • Height/length, • Skinfolds, and • Mid-upper arm circumference
Clinical Manifestations • Inadequate weight-for–corrected age, failure to gain adequate weight over a period of time (weight gain velocity), height velocity, weight-for-height, body mass index (BMI), and developmental outcomes help define malnutrition • These growth and anthropometric parameters should be measured serially and plotted on growth charts appropriate for the child's sex, age (corrected if premature), and, if known, genetic disorders, such as trisomy 21. • The American Academy of Pediatrics (AAP) and U.S. Centers for Disease Control and Prevention (CDC) recommend the 2006 World Health Organization (WHO) charts for children up to 2 yr of age who are measured supine for length. • The CDC 2000 growth charts are recommended for children and adolescents • (age 2-20 yr) when measured with a standing height. • The severity of malnutrition (mild, moderate, or severe) may be determined by plotting the z score (standard deviation [SD] from the mean) for each of these anthropometric values