1 / 1

L 12 73 52 25 72 70 65 75 U M

L 12 73 52 25 72 70 65 75 U M. 200. 100. L 12 127 52 120 75 30 66 113 U M. 200. 100. B. A. L 12 50 120 115 65 75 30 66 U M. Supplemental Data Figure 2: clinical samples LAMP and MS-PCR analysis

abner
Download Presentation

L 12 73 52 25 72 70 65 75 U M

An Image/Link below is provided (as is) to download presentation Download Policy: Content on the Website is provided to you AS IS for your information and personal use and may not be sold / licensed / shared on other websites without getting consent from its author. Content is provided to you AS IS for your information and personal use only. Download presentation by click this link. While downloading, if for some reason you are not able to download a presentation, the publisher may have deleted the file from their server. During download, if you can't get a presentation, the file might be deleted by the publisher.

E N D

Presentation Transcript


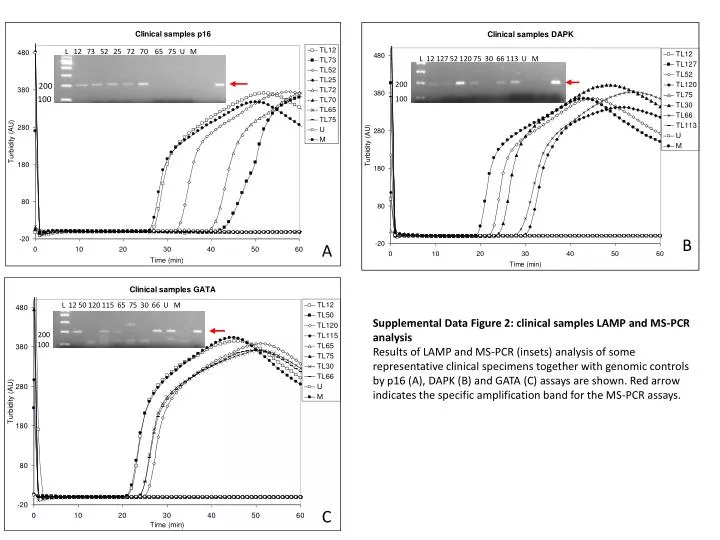
  1. L 12 73 52 25 72 70 65 75 U M 200 100 L 12 127 52 120 75 30 66 113 U M 200 100 B A L 12 50 120 115 65 75 30 66 U M Supplemental Data Figure 2: clinical samples LAMP and MS-PCR analysis Results of LAMP and MS-PCR (insets) analysis of some representative clinical specimens together with genomic controls by p16 (A), DAPK (B) and GATA (C) assays are shown. Red arrow indicates the specific amplification band for the MS-PCR assays. 200 100 C

More Related