Download
1 / 13
130 likes | 140 Views
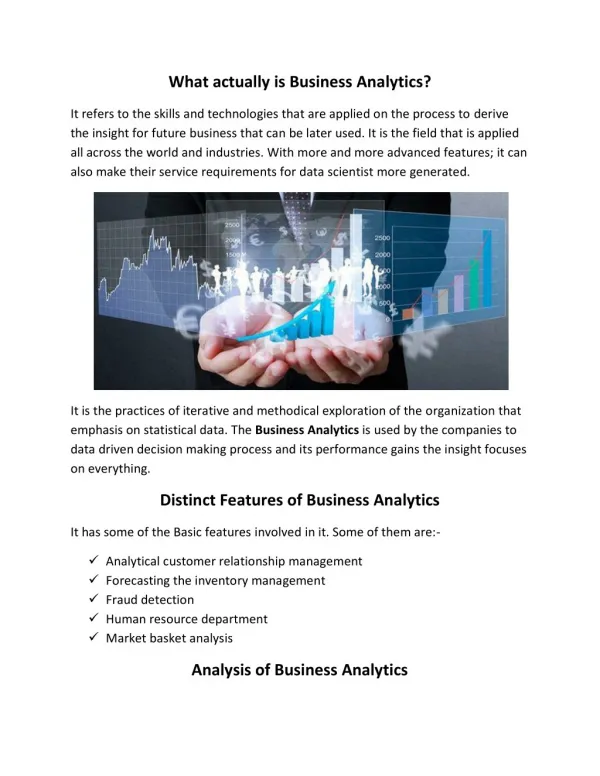
MIS 271 – The Journey from Intermediate Business Programming to Business Analytics. Mauricio Featherman, Ph.D. Washington State University. Background Info. The number of business analyst, management analyst, business intelligence specialist, and database analyst positions remains strong.

E N D
MIS 271 – The Journey from Intermediate Business Programming to Business Analytics Mauricio Featherman, Ph.D. Washington State University
Background Info • The number of business analyst, management analyst, business intelligence specialist, and database analyst positions remains strong. • MIS majors will now receive 2 data analysis\business intelligence classes (MIS271/420). These courses along with MIS372 will help to prepare you for one of the aforementioned analyst positions. • MIS271 focuses on delivering business performance management reporting and solutions, and analytics to improve business processes. • Professor Featherman has created all new content for MIS271 – this content is explained in these slides • MIS420 also has new BI content – business intelligence – think of this as an advanced database & business analysis course.
MIS271 Course Content - Business Analytics • 40% - Creating databases, and data manipulation using different front-end tools (MS-Excel, MS-Access forms, Visual Studio.NET Windows forms -syntax-based and codeless, ASP.NET web pages, Sharepoint webpages) and using different databases (MS-Access and SQLServer) • 40% - Using reporting tools to analyze data, in support of managerial decision-making (using MS-Access reporting, Crystal Reports, Visual Studio forms, Sharepoint webpages, and SQLServer Reporting Services) • 20% - Using graphing and dashboarding tools to visualize and analyze data, in support of managerial decision-making (MS-Excel Pivot tables, Crystal Reports, and SQLServer Reporting Services)
Did this used to be a programming class? • Yes, but now we leverage new codeless point, click, and tailor methods. Some typed syntax is used but not very much. • You can get many types of applications up and running pretty quickly using the new codeless tools made available. Don’t underestimate the power of these tools! • For example using Crystal Reports or Sharepoint Designer requires choosing and clicking pre-built options, rather than hacking out syntax (for example would you use Google Calendar or create your own using ASP.NET?) What if you were tasked to create a calendaring system for a department? • You will learn a ton of useful development and analysis techniques, while the goal is to do this in a fun way
But I want to program! • Better take a CS course or do self-study. Here is a link. • We will also write some syntax based expressions and SQL statements to push the limits of Crystal Reports and SQLServer Reporting Services. • Learning how to use codeless development techniques is important however for prototype development and small system rapid application development. • We can develop a lot of very advanced functionality very quickly, by using new codeless techniques
Class format • The class is largely a hands-on, lab based course • You will learn from professor-led guided tours • In class assignments will be based on the guided tours • Watch videos and read web content to learn more about the development processes. • Homework expands on class experiences. Exams are based on the homework and readings • This means class attendance and participation are pretty important! • Homework and class exercises are done in 2-person teams, while exams are not (you have to do these on your own)
MIS271 content (detail) • Creating Databases, tables, and table relations – MS Access and SQLServerData inputand manipulation – – Wizard-based and code-based VB.NET forms, ASP.NET web pages and Sharepoint Web pages • Datagridviews (tabular based) • Forms based (separate controls) • Databases are MS-Access and SQLServer • Filtering and Sorting data(Access QBE, Windows forms Access\SQLServer, Sharepoint or ASP.NET form Access\SQLServer) Analysis and Decision Support- Crystal Reports, SQLServer Reports, Sharepoint Views, derived data, conditional actions • Reporting and Charting - Crystal Reports, SQLServer Reports, Sharepoint Views, MS-Excel pivot tables Taking corrective action – automating SMTP server messages, adding hyperlinks and email links within reports.
Database Creation and Data Manipulation • Creating, relating, and populating databases and Tables • Simple database creation - 2 tables (Categories\Products, Customers\Sales, Machine\Rentals • In Access • In SQL Server • Data manipulation – wizards, no-code approach • In Access (table entry, form entry) • In Windows Form using VB and VS.NET (datagridview) • In Sharepoint – DataGridView and DetailsView • Data manipulation – easy code, TableAdapter approach • In Windows Form using VB and VS.NET (datagridview) • In ASP.NET web pages
Filtering, Sorting, Grouping Data, and Creating Derived Data • Display filtered and sorted data in a datagridview • Using MS-Excel to sort, group and subtotal data • Using QBE in Access to create a results table • Using Excel’s data filtering and sorting tools • Using QBE facility in VS.NET’s TableAdapter wizard • Windows project, ASP.NET project, Sharepoint web page • Using a DataAdater’s commandtext (Access and SQLServer). • Windows project, ASP.NET project • Using the Dataview’s rowfilter, and sort methods. • Windows project, ASP.NET project • Mast-Detail forms in VB projects
Analysis and Decision Support • Analytical Features of VB’s datagridviews and Reporting Systems (Crystal Reports, Access Reports, SQLServer Reports) • Highlighting exceptions (conditional field masks) • Identifying trends • Top Ten or Top 10% records (Stars and Dogs Report) • Drill-down capabilities • Calculated fields using conditional operators (IIF and Select Case processing)
Reporting, Graphing, Dashboarding • Tools • Crystal reports – within a VB.NET Windows project • Access reports – with Access database • SQLServer Report Services – within a BI report server project • SharePoint Reporting using dataviews • MS-Excel Pivit tables • Features • Simple, grouped, aesthetically pleasing lists • Selecting fields to report • Parameterized reports • Group summaries • Sorting, grouping, filtering • Formula Fields, Expressions • Master-Detail Reports • Cross-tabs • Pie charts, line graphs, bar charts, etc • In Line reporting, drill-down reporting
Taking Corrective Action – if time allows • Emailing employees, vendors or customers based on criteria • Windows forms and ASP.NET page-based bulk emails (from filtered datagridview, or checked rows) • As an alert set up in Sharepoint Reporting • E-mail based Data Collection (surveys) using MS-Access • Hyperlinks and email links within Crsytal reports and SQLServer reports
Concluding comments • Guess who’s idea it was to make many changes to the MIS curriculum over the years? • This course is intended to transfer a ton of skills to you in a show-tell-do format • You probably won’t realize the value and unique perspective of this course until your first MIS-internship when you say “I can do that, can’t everyone?” • Lets have some fun!