Download
1 / 21
210 likes | 490 Views
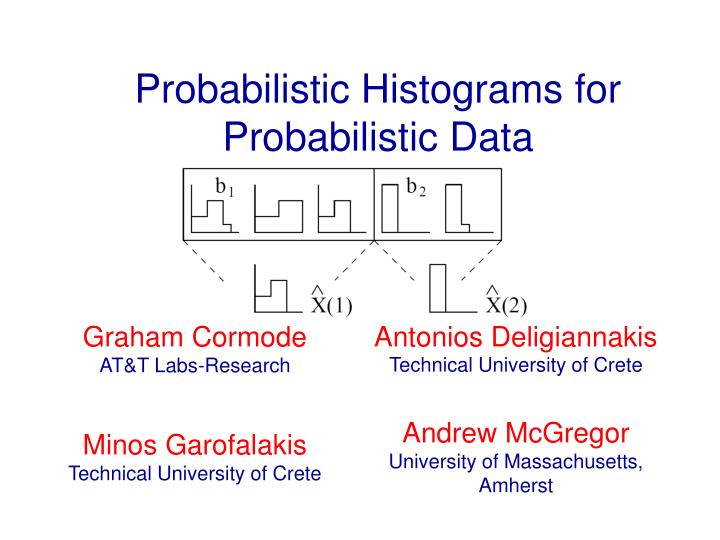
Probabilistic Histograms for Probabilistic Data. Talk Outline. The need for probabilistic histograms Sources and hardness of probabilistic data Problem definition, interesting metrics Proposed Solution Query Processing Using Probabilistic Histograms Selections, Joins, Aggregation etc

E N D
Talk Outline • The need for probabilistic histograms • Sources and hardness of probabilistic data • Problem definition, interesting metrics • Proposed Solution • Query Processing Using Probabilistic Histograms • Selections, Joins, Aggregation etc • Experimental study • Conclusions and Future Directions
Sources of Probabilistic Data • Increasingly data is uncertain and imprecise • Data collected from sensors has errors and imprecisions • Record linkage has confidence of matches • Learning yields probabilistic rules • Recent efforts to build uncertainty into the DBMS • Mystiq, Orion, Trio, MCDB and MayBMS projects • Model uncertainty and correlations within tuples • Attribute values using probabilistic distribution over mutually exclusive alternatives • Assume independence across tuples • Aim to allow general purpose queries over uncertain data • Selections, Joins, Aggregations etc
Probabilistic Data Reduction • Probabilistic data can be difficult to work with • Even simple queries can be #P hard [Dalvi, Suciu ’04] • joins and projections between (statistically) independent probabilistic relations • need to track the history of generated tuples • Want to avoid materializing all possible worlds • Seek compact representations of probabilistic data • Data synopses which capture key properties • Can perform expensive operations on compact summaries
Shortcomings of Prior Approaches • [CG’09] builds histograms that minimize the expectation of a given error metric • Domain split in buckets • Each bucket approximated by a single value • Too much information lost in this process • Expected frequency of an item tells us little about its probability that it will appear i times • How to do joins, or selections based on frequency? • Not a complete representation scheme • Given maximum space, input representation cannot be fully captured
Our Contribution • A more powerful representation of uncertain data • Represent each bucket with a PDF • Capture prob. of each item appearing i times • Complete representation • Target several metrics • EMD, Kullback-Leibler divergence, Hellinger Distance • Max Error, Variation Distance (L1), Sum Squared Error etc
Talk Outline • The need for probabilistic histograms • Sources and hardness of probabilistic data • Problem definition, interesting metrics • Proposed Solution • Query Processing Using Probabilistic Histograms • Selections, Joins, Aggregation etc • Experimental study • Conclusions and Future Directions
Probabilistic Data Model • Ordered domain U of data items (i.e., {1, 2, …, N}) • Each item in U obtains values from a value domain V • Each with different frequency each item described by PDF • Example: • PDF of item i describes prob. that i appears 0, 1, 2, … times • PDF of item i describes prob. that i measured value V1, V2 etc
Used Representation Start: s End: e of bucket • Goal: Participate U domain into buckets • Within each bucket b = (s,e) • Approximate (e-s+1) pdfs with a piece-wise constant PDF X(b) • Error of above approximation • Let d() denote a distance function of PDFs • Given a space bound, we need to determine • number of buckets • terms (i.e., pdf complexity) in each bucket Typically, summation or MAX
Targeted Error Metrics Common Prob. metrics
General DP Scheme: Inter-Bucket • Let B-OPTb[w,T] represent error of approximating up to wV first values of bucket b using T terms • Let H-OPT[m, T] represent error of first m items in U when using T terms w Error approximating first w values of PDFS within bucket b Using T terms for bucket b Check all start positions of last bucket, terms to assign Use T-t terms for the first k items Where the last bucket starts Approximate all V+1 frequency values using t terms
General DP Scheme: Intra-Bucket • Each bucket b=(s,e) summarizes PDFs of items s,…,e • Using from 1 to V=|V | terms • Let VALERR(b,u,v) denotes minimum possible error of approximating the frequency values in [u,v] of bucket b. Then: • Intra-Bucket DP not needed for MAX Error (L) distance • Compute efficiently per metric • Utilize pre-computations Use T-1 terms for the first u frequency values of bucket Where the last term starts
Sum Squared Error & (Squared) Hellinger Distance • Simpler cases (solved similarly). Assume bucket b=(s,e) and wanting to compute VALERR(b,v,w) • (Squared) Hellinger Distance (SSE is similar) • Represent bucket [s,e]x[v,w] by single value p, where • VALERR(b,v,w) = • VALERR computed in constant time using O(UV) pre-computed values, given Computed by 4 A[ ] entries Computed by 4 B[ ] entries
Variation Distance • Interesting case, several variations • Best representative within a bucket = median P value • , where • Need to calculate sum of values below median two-dimensional range-sum median problem • Optimal PDF generated is NOT normalized • Normalized PDF produced by scaling = factor of 2 from optimal • Extensions for ε-error (normalized) approximation
Other Distance Metrics • Max-Error can be minimized efficiently using sophisticated pre-computations • No Intra-Bucket DP needed • Complexity lower than all other metrics: O(TVN2) • EMD case is more difficult (and costly) to handle • Details in the paper…
Handling Selections and Joins • Simple statistics such as expectation are simple • Selections on item domain are straightforward • Discard irrelevant buckets - Result is itself a prob. histogram • Selections on the value domain are more challenging • Correspond to extracting the distribution conditioned on selection criteria • Range predicates are clean: result is a probabilistic histogram of approximately same size Pr Pr 1/2 1/3 1/6 Pr[X=x | X ≥ 3] 0.3 0.2 0.1 X X 1 2 3 4 5 1 2 3 4 5
Handling Joins and Aggregates boundaries • Result of joining two probabilistic relations can be represented by joining their histograms • Assume pdfs of each relation are independent • Ex: equijoin on V : Form join by taking product of pdfs for each pair of bucket intersections • If input histograms have B1, B2 buckets respectively, the result has at most B1+B2-1 buckets • Each bucket has at most: T1+T2-1 terms • Aggregate queries also supported • I.e., count(#tuples) in result • Details in the paper… Join on V Pr Pr Pr Product of X X X
Experimental Study • Evaluated on two probabilistic data sets • Real data from Mystiq Project (127k tuples, 27,700 items) • Synthetic data from MayBMS generator (30K items) • Competitive technique considered: IDEAL-1TERM • One bucket per EACH item (i.e., no space bound) • A single term per bucket • Investigated: • Scalability of PHist for each metric • Error compared to IDEAL-1TERM
Quality of Probabilistic Histograms • Clear benefit when compared to IDEAL-1TERM • PHist able to approximate full distribution
Scalability • Time cost is linear in T, quadratic in N • Variation Distance (almost cubic complexity in N) scales poorly • Observe “knee” in right figure. Cost of buckets with > V terms is same as with EXACTLY V terms => INNER DP uses already computed costs
Concluding Remarks • Presented techniques for building probabilistic histograms over probabilistic data • Capture full distribution of data items, not just expectations • Support several minimization metrics • Resulting histograms can handle selection, join, aggregation queries • Future Work • Current model assumes independence of items. Seek extensions where this assumption does not hold • Running time improvements • (1+ε)-approximate solutions [Guha, Koudas, Shim: ACM TODS 2006] • Prune search space (i.e., very large buckets) using lower bounds for bucket costs