Download
1 / 4
40 likes | 173 Views
Suppose that the data points are where is the independent variable and is the dependent variable. The least-squares line uses a straight line. The best fitting line has the least square error(E). Least-Square Fitting.

E N D
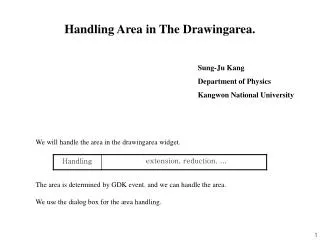
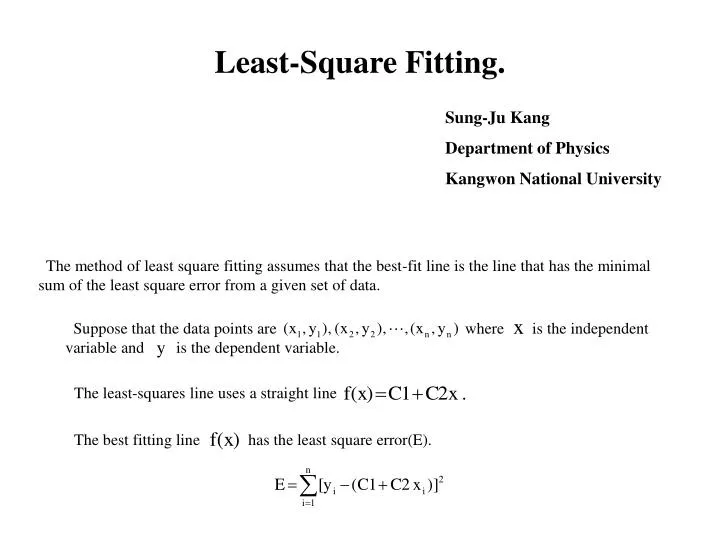
Suppose that the data points are where is the independent variable and is the dependent variable. The least-squares line uses a straight line The best fitting line has the least square error(E). Least-Square Fitting. Sung-Ju Kang Department of Physics Kangwon National University The method of least square fitting assumes that the best-fit line is the line that has the minimal sum of the least square error from a given set of data.
To obtain the least square error, the unknown coefficients and must yield zero first derivatives. The unknown coefficients and can therefore be obtained: *** Standard Deviation : Standard deviation is defined as where are the data points.
Programming with C language #include <stdio.h> #include <math.h> double x,y,c1,c2,SD,AX,AY,AXX,AXY; int N,i,j; double X[1000], Y[1000]; char FINN[20],FOUTN[20]; FILE *FIN,*FOUT; void fit(); void main() { printf("\nINPUT THE NAME OF THE INPUT FILE\n"); scanf("%s", FINN); if((FIN=fopen(FINN, "r"))==NULL) { printf("FILE OPEN ERROR... \n"); exit(-1); } printf("INPUT THE NUMBER OF THE DATA\n"); scanf("%d",&N); printf("\n INPUT THE NAME OF THE OUTPUT FILE\n"); scanf("%s", FOUTN); if((FOUT=fopen(FOUTN, "w"))==NULL) { printf("FILE OPEN ERROR... \n"); exit(-1); } for(i=1;i<=N;++i) { fscanf(FIN,"%lf %lf",&x,&y); X[i]=x; Y[i]=y; printf("X=%20.16lf Y=%20.16lf\n ",X[i],Y[i]); } fit(); printf("c1=%20.16lf c2=%20.16lf\nSD=%20.16lf\n\n ",c1,c2,SD); fprintf(FOUT,"c1=%20.16lf c2=%20.16lf\nSD=%20.16lf\n\n ",c1,c2,SD); getch(); fclose(FIN); fclose(FOUT); } void fit() { AX=0.0;AY=0.0;AXX=0.0;AXY=0.0; for(i=1;i<=N;i++){ AX=AX+X[i]; AY=AY+Y[i]; AXX=AXX+X[i]*X[i]; AXY=AXY+X[i]*Y[i];} c1 = ((AY*AXX)-(AX*AXY))/(((N+1.0)*AXX)-(AX*AX)) ; c2 = (((N+1)*AXY)-(AX*AY))/((N+1.0)*AXX-AX*AX) ; SD=0.0; for(i=1;i<=N;i++){SD=SD+(pow((Y[i]-(c2*X[i]+c1)),2.0))/((N+1)-2);} SD=sqrt(SD); }
Summary 1. The method of least square fitting assumes that the best-fit line is the line that has the minimal sum of the least square error from a given set of data. 2. Standard deviation is defined the distribution of the data.