Download
1 / 1
10 likes | 95 Views
Effective Tax Rates by Classification. Centrally Residential Agricultural Commercial Assessed Total 2002 1.89% 1.11% 2.22% 1.60% 1.61% 2003 1.91% 1.11% 2.26% 1.61% 1.62% 2004 1.83% 1.08% 2.21% 1.66% 1.57% 2005 1.83% 0.92% 2.18% 1.64% 1.50%

E N D
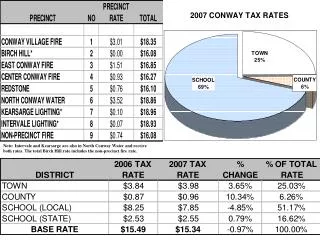
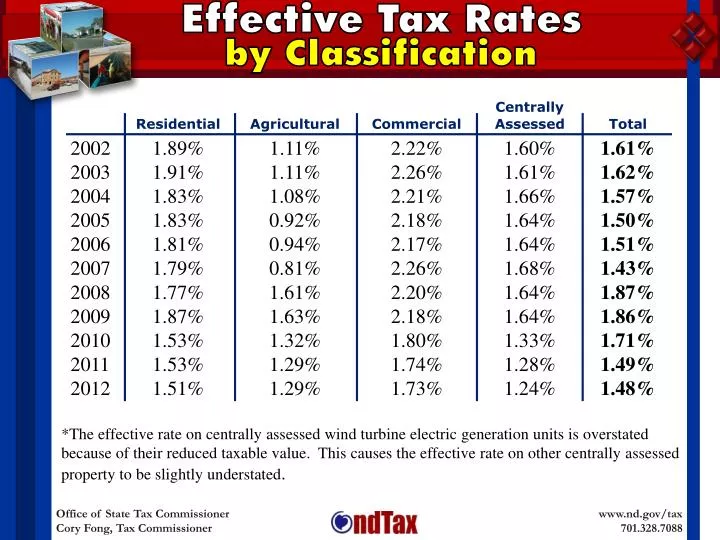
Effective Tax Rates by Classification Centrally Residential Agricultural Commercial Assessed Total 2002 1.89% 1.11% 2.22% 1.60% 1.61% 2003 1.91% 1.11% 2.26% 1.61% 1.62% 2004 1.83% 1.08% 2.21% 1.66% 1.57% 2005 1.83% 0.92% 2.18% 1.64% 1.50% 2006 1.81% 0.94% 2.17% 1.64% 1.51% 2007 1.79% 0.81% 2.26% 1.68% 1.43% 2008 1.77% 1.61% 2.20% 1.64% 1.87% 2009 1.87% 1.63% 2.18% 1.64% 1.86% 2010 1.53% 1.32% 1.80% 1.33% 1.71% 2011 1.53% 1.29% 1.74% 1.28% 1.49% 2012 1.51% 1.29% 1.73% 1.24% 1.48% *The effective rate on centrally assessed wind turbine electric generation units is overstated because of their reduced taxable value. This causes the effective rate on other centrally assessed property to be slightly understated.