Download
1 / 23
230 likes | 356 Views
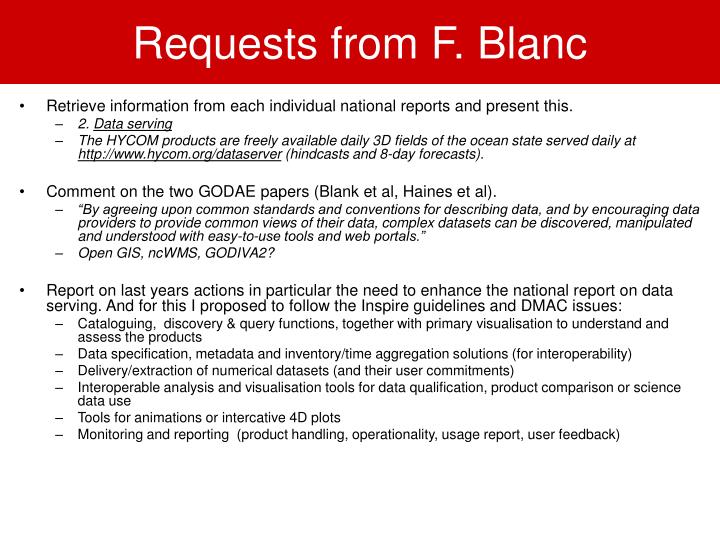
Requests from F. Blanc. Retrieve information from each individual national reports and present this. 2. Data serving The HYCOM products are freely available daily 3D fields of the ocean state served daily at http://www.hycom.org/dataserver (hindcasts and 8-day forecasts).

E N D
Requests from F. Blanc • Retrieve information from each individual national reports and present this. • 2. Data serving • The HYCOM products are freely available daily 3D fields of the ocean state served daily at http://www.hycom.org/dataserver (hindcasts and 8-day forecasts). • Comment on the two GODAE papers (Blank et al, Haines et al). • “By agreeing upon common standards and conventions for describing data, and by encouraging data providers to provide common views of their data, complex datasets can be discovered, manipulated and understood with easy-to-use tools and web portals.” • Open GIS, ncWMS, GODIVA2? • Report on last years actions in particular the need to enhance the national report on data serving. And for this I proposed to follow the Inspire guidelines and DMAC issues: • Cataloguing, discovery & query functions, together with primary visualisation to understand and assess the products • Data specification, metadata and inventory/time aggregation solutions (for interoperability) • Delivery/extraction of numerical datasets (and their user commitments) • Interoperable analysis and visualisation tools for data qualification, product comparison or science data use • Tools for animations or intercative 4D plots • Monitoring and reporting (product handling, operationality, usage report, user feedback)
Report on Product & Data servers • Lack of visibility • Impressed by internet services offered • standalone catalogues • primary viewing services • interoperable extraction tools • integrated • Should be more promoted Catalogue of services (cf. GCMD) • Ground common technology Access & Inventory Opendap/Thredds + NetCDF/CF (= GODAE standard) Contribution from F. Blanc for IGST, August 2007
Report on Product & Data servers • Lack • Missing user guidance • System descriptions • Guide for products, • Guide for services, Contribution from F. Blanc for IGST, August 2007
Report on Product & Data servers • Input in national reports available afterwards • available online ? Using CMS technology ? • not so homogeneous what do we expect from this report with respect to data servers ? • What services on data are available (catalogue, viewing, delivery, user guidance) • Report on operationality & qualification wrt production • Report on user (who, products requested, how often, for what for) • Report on technology & capacities (volume, handling, networking) • Strong and weak features Contribution from F. Blanc for IGST, August 2007
Contribution from F. Blanc for IGST, August 2007
2) My Ocean Web Portal Example May 2008 – F. Blanc (fblanc@cls.fr)
Example May 2008 – F. Blanc (fblanc@cls.fr)
What will be available at T18 • Good support for visualizing in situ obs (hopefully) • (developed under ECOOP project) • Map will show positions of observations • User clicks on observation to find more detail • (will require agreement upon file formats and metadata conventions for such data. Not yet covered by CF) • Depends on being able to discover obs locations!! • Dynamic interpolation from sigma to zed levels • Support for non-map outputs such as vertical sections • Needs discussion to establish priorities My Ocean Web Map Service (INSPIRE-compliant visualization service)
THREDDS THREDDS THREDDS WMS WMS WMS OPeNDAP OPeNDAP OPeNDAP WCS? WCS? WCS? Anticipated “final” deployment MFC 1 NetCDF MFC 2 NetCDF TAC 1 NetCDF WMS bundled with THREDDS MFCs/TACs install single piece of software My Ocean Web Map Service (INSPIRE-compliant visualization service)
Dynamic Quick View (DQV) Service • Gives very fast previews of 4-D data on an interactive website • Reads data from OPeNDAP servers at the MERSEA TEPs • Draggable, zoomable map • Allows the fast creation of animations • Based on a standards-compliant Web Map Service
Selection of depth Select from all the depth levels of the model
Selection of time (range) Select from all the timesteps in the model Selection of a time range leads to an animation
Finding the data value at a point Click on the data layer, data value and precise position is shown Lon: -64.08 Lat: 36.21 Value: 19.27
Timeseries plots If a time range is selected, can create a timeseries plot at a point
Export to Google Earth • DQV website contains link to load currently-visible data into Google Earth • Our WMS outputs in KMZ format • Can then view data alongside other KML datasets • e.g. DAMOCLES • Can view animations of data • No problem with map projections!
Visualize alongside third-party data • Hurricane Katrina, August 2005 • Showing sea surface temperature (UK Met Office) and storm position/intensity (ECMWF) • Winds cause upwelling of cooler subsurface water on right-hand side of the cyclonic storm track
Selection of non-MERSEA datasets also available OSTIA (GHRSST-PP): SST and sea ice high res (1/20°) NSIDC Snow-water equiv. (non-NetCDF) ECMWF System 3 Reanalysis Everything on the website can be exported to Google Earth
Important features of our WMS implementation • Fast generation of images • Handling of four-dimensional data • Handling of data on unusual grids, e.g. NEMO • Dynamic change of colour scale extent • Generation of animations • Export to Google Earth
MERSEA data in third-party clients NASA World Wind Cadcorp SIS Google Earth
In-situ data • Picture left shows comparison of NEMO model and observations for Nov 2004 • Red dots show bad model-obs fits, green dots are good fits • Google Earth allows very efficient browsing of these large datasets • Could do the same for MERSEA systems, e.g. CORIOLIS • Could read obs and model data from different sources and bring together in Google Earth or another client
DQV future enhancements • Display of wind/current fields as vectors • Caching of image tiles for performance increase • Support for more map projections • E.g. polar stereographic • Display of observations on website • Integration with GeoServer, THREDDS • Requires community assistance • …Lots more!
Summary • Lots going on • Section II of report is important • Guidance to users is required on how to get/use tools • Need a master directory