Download
1 / 12
180 likes | 358 Views
Waiting Line Models. Waiting takes place in virtually every productive process or service. Since the time spent by people and things waiting in line is a valuable resource, the reduction of waiting time is an important aspect of operations management. Quality Service = Quick Service

E N D
Waiting Line Models Waiting takes place in virtually every productive process or service. Since the time spent by people and things waiting in line is a valuable resource, the reduction of waiting time is an important aspect of operations management. Quality Service = Quick Service More service capacity = Less waiting time = Increased Cost Goal of Queuing Theory (another name for Waiting Line theory) is to find the trade-off point between the cost of improved service and the cost of making the customer wait.
Why do waiting lines form? • People or things arrive at the server faster than they can be served. • Customers arrive at random times, and the time required to serve each individually is not the same. • What are the cost relationships in Waiting Line Analysis? • As the level of service improves, the cost of service increases • Better service requires more servers
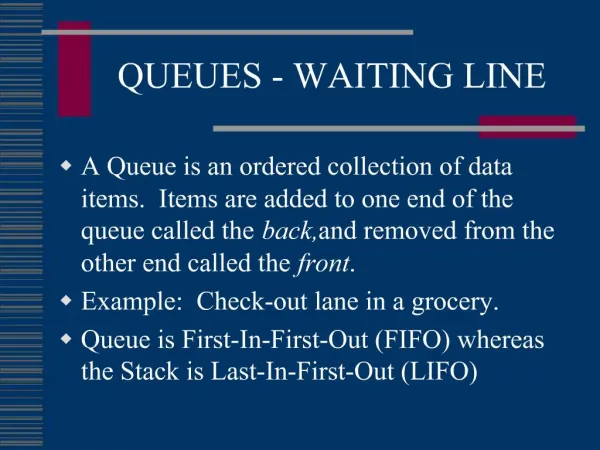
The Calling Population - the source of the customers to the queuing system: can be either infinite or finite. The Arrival Rate - the frequency at which customers arrive at a waiting line according to a probability distribution (average arrival rate is signified by l ) Service Time - the time required to serve a customer, is most frequently described by the negative exponential distribution ( average service rate is signified by m ) Queue Discipline and Length - the order in which customers are served First come, first served Last in, first out Random Alphabetically What are the elements of a waiting line?
Basic Waiting Line Structures • Four basic structures of waiting lines, determined by the nature of the service facilities. Channels are the number of parallel servers, phases denote the number of sequential servers a customer must go through to receive service. • Single channel, single phase - All customers go through single server one at a time for entire process • Single channel, multiple phase - All customer go through a series of servers one at a time to complete the process. • Multiple channel, single phase - All customers get split up into a group of servers one at a time for the entire process. • Multiple channel, multiple phase - All customers get split into a group servers and further proceed through a series of servers to complete the process.
Operating Characteristics • Notation Operating Characteristics . • L Average number of customers in the system • Lq Average number of customers in the waiting line • W Average time a customer spends in the system • Wq Average time a customer spends waiting in line • P0 Probability of no (zero) customers in the system • Pn Probability of n customers in the system • r Utilization rate; proportion of time the system is in use.
Single-Channel, Single-Phase There are several variations of the single server waiting line system: • Poisson arrival rate, exponential service times • Poisson arrival rate, general (or unknown) distribution of service times • Poisson arrival rate, constant service times • Poisson arrival rate, exponential service times with a finite queue • Poisson arrival rate, exponential service times with a finite calling population
Single-Channel, Single-Phase In our single-server model, we will assume the following: • Poisson Arrival RateExponential Service • TimesFirst-come, first-serve queue discipline • Infinite queue length • Infinite calling population
Single-Channel, Single-Phase The symbols which we will use are: • l = mean arrival rate • m = mean service rate
Single-Channel, Single-Phase FORMULAS • Probability that no customers are in queuing system, P0 = ( 1 - l/m ) • Probability that exactly n customers in the system, Pn = ( l/m )n * P0 • Average number of customers in the system, L = ( l / m-l ) • Average number of customers in the waiting line, Lq = ( l2 / m(m-l) • Average time a customer spend in system, W = L / l • Average time customer spends waiting in line, Wq = ( l / m(m-l) ) • Probability that the server is busy (utilization factor), r = l/m • Probability that the server is idle, I = 1 - r
Multiple-Channel, Single-Phase In our multiple-server model, we will assume the following: • Poisson Arrival Rate • Exponential Service Times • First-come, first-serve queue discipline • Infinite queue length • Infinite calling population
Multiple-Channel, Single-Phase The symbols which we will us are: • l = mean arrival rate • m = mean service rate • s = number of servers
Multiple-Channel, Single-Phase FORMULAS • Probability that no customers are in queuing system, P0 = look to Table • Probability that exactly n customers in the system, Pn = (1/s!sn-s)*( l/m )n * P0 for n > s Pn = ( 1/n! )*( l/m )n * P0 for n <= s • Average number of customers in the system, L = ( lm(l/m)s / (s-1)!(sm-l )2)P0 + l/m • Average number of customers in the waiting line, Lq = L - l/m • Average time a customer spend in system, W = L / l • Average time customer spends waiting in line to be served, Wq = W - 1 / m • Probability that the server is busy (utilization factor), r = l/sm • Probability that the server is idle and customer can be served, I = 1 - r