Download
1 / 20
200 likes | 215 Views
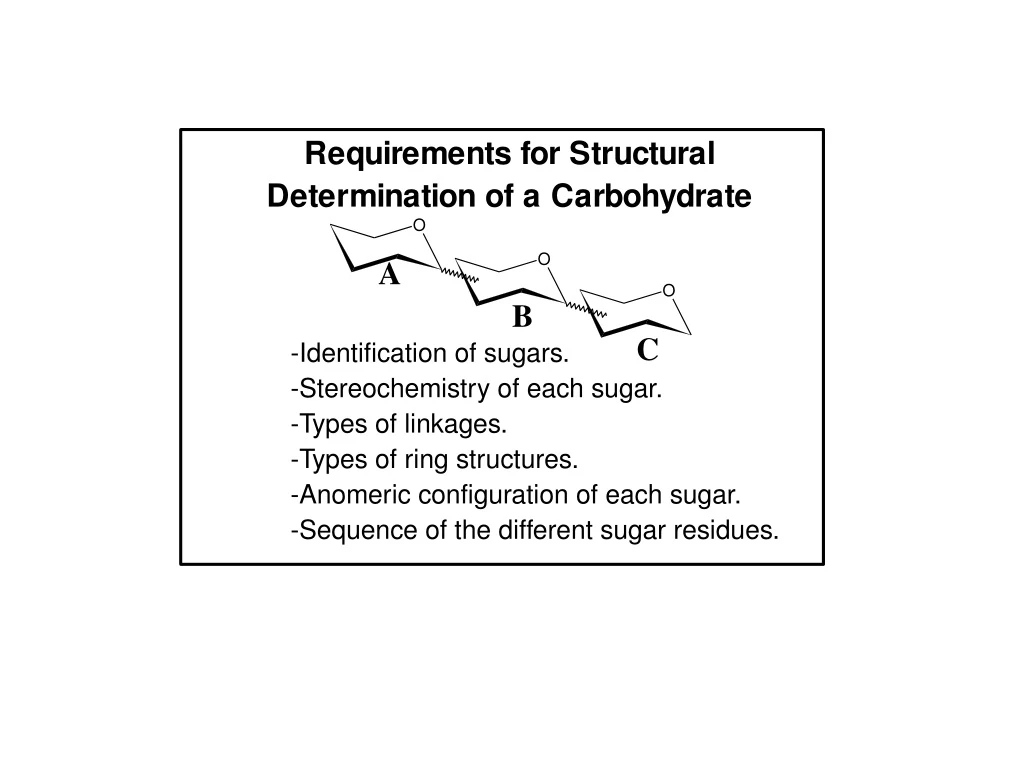
Glycosyl Composition Analysis. Gal. Inositol. Ara. Peak Area. Gal. Ara. Gal. Gal. Glc. Man. Xyl. Glc. 10. 15. 20. 25. 30. Time (minutes). Glycosyl Linkage Analysis. 3,6-Gal. t-Ara(f). 3-Gal. Intensity. 6-Gal. 4-Gal. 4-Glc. t-Gal. Inositol. t-Man. 5-Ara(f). t-Glc.

E N D
Glycosyl Composition Analysis Gal Inositol Ara Peak Area Gal Ara Gal Gal Glc Man Xyl Glc 10 15 20 25 30 Time (minutes)
Glycosyl Linkage Analysis 3,6-Gal t-Ara(f) 3-Gal Intensity 6-Gal 4-Gal 4-Glc t-Gal Inositol t-Man 5-Ara(f) t-Glc 6-Glc 4-Xyl(p) t-Ara(p) 10 15 20 25 30 Time (minutes)
C H D OA c OM e 118 205 M e O 162 161 OM e OA c 45 C H OM e 2 Primary Fragments Secondary Fragments + + C H O M e C H O M e H C O M e - HOAc H C OM e H C O A c H C C H O M e C H OM e 2 2 m/z 205 m/z 145 Primary and Secondary Fragments of the PMAA of Terminal Glucose
Glycosyl Linkage Analysis 3,6-Gal t-Ara(f) 3-Gal Intensity 6-Gal 4-Gal 4-Glc t-Gal Inositol t-Man 5-Ara(f) t-Glc 6-Glc 4-Xyl(p) t-Ara(p) 10 15 20 25 30 Time (minutes)
Glycosyl linkage analysis performed with an additional pre-reduction step 4-Glc Pre-6-glc t-Glc t-Rha 6-Glc Inositol 10 15 20 25 30 Time Minutes Peak Area
Site Mapping on Glycoproteins • N-linked • O-linked
627.0 (M+2)/2 625.5 (M+H) 1253.1 1250.0 N-linked site mapping on an ion-trap with a mixture Of 016 and 018 Water
(M+2)/2 of Peptide + 5 hexoses +1 +0 +2 +3 +4 * * * * * BEMAD 40ATTCTFSGSEASK54 # # Direct Fig. X: Site-Mapping of O-hexose sites on Peptides of PGC. Shown is the MS/MS spectra of a tryptic peptide from PGC. MS3 sequencing of 702.2 identified the peptide ATTCTFSGSEASK. Direct sequencing of PGC peptides identified two of the sites (#) while BEMAD site mapping identified all 5 sites of modification. In full, a total of 7 sites of O-Mannose modification (T42,T43, T45, S47, S49, S110, and S154) were identified for PGC.
Figure 4: BEMAD Methodology. (A) Schematic of the b-elimination, Michael (conjugate) addition with DTT approach for replacing O-GlcNAc with a stable tag. (B) M+H of O-GlcNAc modified peptide before BEMAD and (C) M+H of peptide following chemistry by MALDI-TOF analysis. (D) DTT-modified peptide can be purified from a mixture using thiol-chromatography.
Figure 6. ECD Fragmentation of O-GlcNAc Modified Peptide. Fragmentation of doubly charged parent ion of O-GlcNAc modified peptide on a LTQ-FT (Finnigan) using ECD fragmentation. Note mass accuracy of less than 2 ppm and Z7-Z12 and C7 ions still contain O-GlcNAc modified serine.