Download
1 / 32
320 likes | 354 Views
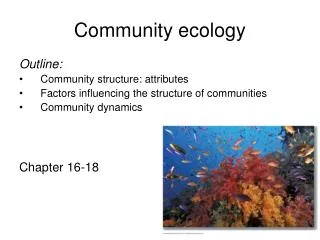
Major Questions What factors determine community structure? Why are some communities more resilient to disturbances than others? A disturbance is any discreet event that removes organisms and opens space for colonization of same or different species.

E N D
Major Questions What factors determine community structure? Why are some communities more resilient to disturbances than others? A disturbance is any discreet event that removes organisms and opens space for colonization of same or different species
Stable vs fragile communities and ecosystems: what does it mean? Ecosystem fragility is: the degree of change in species abundances and in species composition, following disturbance (Nilsson and Grisson 1995)
Ecosystem: a community plus its abiotic environment -- includes biogeochemical cycling from abiotic to biotic and back -- ecosystem function relates to flow of nutrients through system -- disruptions to this flow can cause a chain-reaction of effects
Carbon Cycle Carbon Pools: 1. Atmosphere, 0.035% CO2 2. Ocean, a carbon sink 3. Earth’s crust, 300 Ma deposits 4. Soils, can be a sink, e.g., peat Fig. 25.13 (EFB)
Ecosystem Function affected by: • resource dynamics (e.g., introduced species disrupt nutrient flow such as b-g algae, tamerix) • trophic structure (e.g., removal of keystone species, trophic cascades, such as elephants, deer) • disturbances (e.g., change in frequency of disturbances such as by overgrazing, loss of ESS plants, and topsoil
Trophic Cascades “Trophic cascades are indirect species interactions that originate with predators and spread downward through food webs” (Ripple et al. 2016) Note that this defines cascades as top-down only Bottom-up effects occur too, but are separated from top-down and should be referred to as ‘bottom-up forcing’
Increase in ungulate predation also impacted grasslands and herbivory
Krill Surplus Hypothesis • Extensive slaughter of whales and seals in 19th and 20th centuries in Southern Ocean • Reduced whale populations by 90-95 %, still in recovery • Caused near extinction of Antarctic and sub-Antarctic Fur Seals (Arctocephalus gazella and A. tropicalis) • Resulted in excess krill estimated at ~150 million tons
Krill Surplus Hypothesis: penguins and other krill-eating species benefited from depletion of baleen whales and seals
From Pauly and Maclean (2003). In a Perfect Ocean. Island Press. shifting baseline syndrome
Shifting baseline syndrome Macroalgae dominated reef ecosystem Coral dominated reef ecosystem http://www.climateshifts.org/?p=1758 http://www.thelivingocean.net/2012/08/the-coral-reef-ecosystem.html
Four major pools for nutrients: • Atmosphere (short term storage or residence time) • Ocean (long term, or carbon sink) • Earth’s crust (long term) • Soil (short or long term)
Nutrients transition through the living biomass Residence Time of nutrients: • relates in part to relative abundance and need or demand by biotic part • e.g., air has: 0.035 % CO2, RT < 10 yrs 78 % N2, RT ~20 million yrs 21 % O2, RT 20,000 yrs • air is storage pool for N
General rule is that the more limiting a nutrient, the more tightly it cycles (short RT in abiotic) Determining RT for a nutrient: -- must measure biomass in the community, often done as standing crop biomass (g/m2) -- must measure net productivity, or amount of new tissue growth (g/m2/yr) RT = biomass (g/m2) net productivity (g/m2/yr)
For non-living biotic material, can determine RT for detritus: RT = litter accumulated (g/m2) rate of litter accumulation (g/m2/yr) e.g., tropical forest litter 800 g/m2, accumulates at 4000 g/m2/yr, so RT = 800/4000 or 0.2 yr
Rodin and Brazelevich 1967 AmtTropicsTaiga Living biomass high low RT high high Detritus low high RT low high RT
Oceans as a storage pool for nutrients -- e.g., phosphorus can be very limiting in terrestrial systems -- weathers from rock as phosphates, no gas phase, cycles and washes away -- estimated 13 x 106 tons/yr enter oceans from land with few pathways to return -- how can it get back into terrestrial cycle?
Quiz • What are three main ways that ecosystem function can be impacted by humans with examples. • What are trophic cascades and give an example? • What is meant by ‘fishing down the food web’ and ‘shifting baseline syndrome’? • What are four major nutrient pools for carbon and how is residence time measured? • How is residence time measured for nutrients in detritus? • Why are oceans storage pools and how do limited nutrients such as phosphorus return to terrestrial environments?
Is it possible to manipulate an entire ecosystem to better understand biogeochemical cycling and ecosystem function?
Hubbard Brook Experimental Forest • northern hardwood deciduous forest in NH • relatively closed ecosystem with numerous watersheds for tracking nutrient flow • impermeable bedrock, no losses to ground water, can measure DOM and POM
Calcium cycling Input 2.6 kg/ha/yr (from precip.) + 9.1 kg/ha from weathering bedrock Forest Living Dead 49 kg 0.3 kg lost Output 12.0 kg/ha/yr
Impacts POM 9x Runoff, leaching Light, soil temp., and nitrification H+, leaching, and DOM Soil pH
One exception to these nutrient losses was phosphorus -- input 12.5 kg/ha/yr, output 0.007 kg/ha/yr -- study showed no change after deforestation -- soil pH dropped to < 5, caused by increased nitrification and H+ ions -- phosphorus bonded with Al, Fe in soil and was trapped by insoluable bonds -- can slow recovery of entire system as P is a limiting nutrient
deforested normal Vernal dam
Quiz • Why was Hubbard-Brook an ideal location for studying ecosystem processes? • What are watersheds and weirs and why are nutrient inputs less than outputs at H-B? • Describe the chain-reaction effects in DOM and POM that occurred at H-B when a watershed was clear-cut. • Why was P an exception to losses in DOM after clear-cutting? • What is meant by the ‘vernal dam’?