Download
1 / 37
380 likes | 622 Views
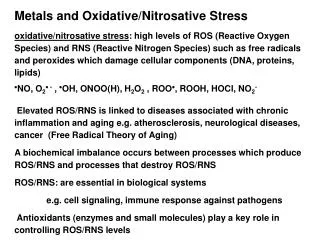
Oxidative stress and caloric restriction. Jan Škrha Professor of Medicine 3 rd Department of Internal Medicine, Laboratory for Endocrinology & Metabolism 1 st Faculty of Medicine, Charles University, Prague IFCC Congress, Berlin 2011. OBESITY AND CONSEQUENCES. Overeating

E N D
Oxidative stress and caloric restriction Jan Škrha Professor of Medicine 3rd Department of Internal Medicine, Laboratory for Endocrinology & Metabolism 1st Faculty of Medicine, Charles University, Prague IFCC Congress, Berlin 2011
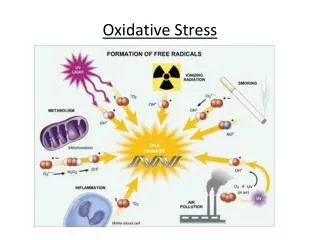
OBESITY AND CONSEQUENCES Overeating Weight increase Higher concentration of circulating FFA Insulin resistance Hyperinzulinemia ROS
FFA – GENERATOR OF INSULIN RESISTANCE AND OXIDATIVE STRESS Insulin FFA IRS-1 phosphoryl. serine/threonine FA-CoA IRS-1 phosphoryl. tyrosine DAG PKC ROS PI-3-kinase NFĸB activation GLUT 4 translocation ROS glucose transport inflammatory proteins Diabetes Care 27, 2004, 2253-9
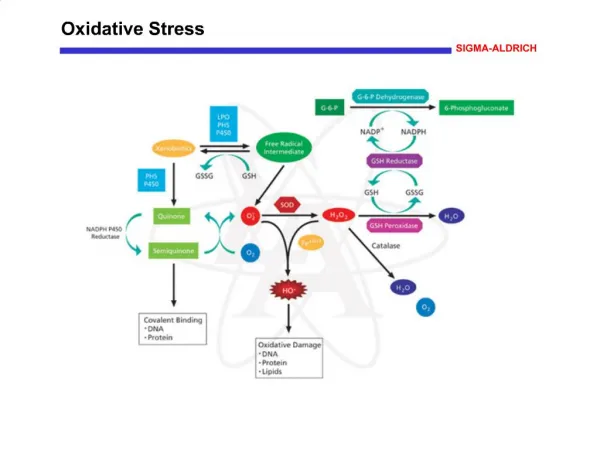
SUPEROXIDE GENERATION IN MITOCHONDRIA Respiratory chain H+ gradient generation Decrease of H+gradient H+ H+ H+ H+ H+ UCP Substrate supply III cyt c IV I Q- e- e- e- II e- NAD+ NADH Succinate ATP ADP + P H2O Fumarate O2 Mn-SOD H2O+O2O2- O2
UNIFYING MECHANISM FOR IMPAIRMENT CAUSED BY HYPERGLYCEMIA AND FFA FFA Glucose GAPDH Polyols AGE PKC Hexosamine NFκB ROS Mitochondria Nucleus Cytoplasm PARP M.Brownlee, Diabetes 2005
ENDOTHELIAL CELL Hyperglycemia Intracellular glucose Reactive oxygen species in mitochondria polyols lipoxidation glycation PKCß hexosamines glycoxidation Endothelial dysfunction GLUT 1 oxidative stress DIABETIC ANGIOPATHY
NITROSATIVE STRESS Endothelial dysfunction
REDUCED SUPEROXIDE GENERATION IN MITOCHONDRIA Respiratory chain H+ gradient generation Decrease of H+gradient H+ H+ H+ H+ H+ Decreased substrate supply UCP III cyt c IV I Q- e- e- e- II e- NAD+ NADH Succinate ATP ADP + P H2O Fumarate O2 Mn-SOD H2O+O2O2- O2 Gredilla et al., FASEB J 2001
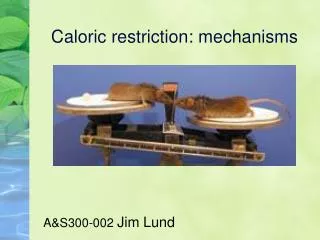
Sirtuins – caloric restriction effectors(silent information regulators – SIRT1-7) family: NAD-dependent histone deacetylases - influencing aging, metabolic processes, tumorigenesis Reduced caloric intake: SIRT1 upregulation increases gluconeogenesis decreases adipocyte formation oposite to insulin sirtuins like „molecular sensor“ Activators Inhibitors • increase life span and cell survival •promote fat mobilization • increase the mitochondria number • stop tumor formation • stop apoptosis • stop neurodegenerative disease
Sirtuins – key regulators of oxidative stress increase of antioxidative defense: by upregulated MnSOD expression by reduced cellular hydrogen peroxide by enhanced mitochondrial glutathion capacity reduced mitochondrial ROS production Caloric restriction vs dietary composition • reduced activity of complex I •restriction of protein intake vs complex III in mitochondria (methionine content) decreased ROS production Crujeiras et al., Europ J Clin Invest 2008, Someya et al., Cell 2010, Sanz et al., J Bioenerg Biomembr 2004
Caloric restriction vs fasting Caloric restriction and short intermitent fasting Prolonged fasting beneficial effects: decreased ROS production mitochondrial protection harmful effects: superoxide anion release from hepatocytes decreased glutathione content Resistance to oxidative stress increased decreased Mattson et al., J Nutr Biochem 2005 Sorensen et al., Free Radic Res 2006
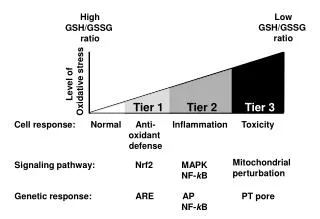
BIOMARKERS Biomarker Caloric restriction Lipid peroxidation Malondialdehyde (MDA) decreased F-2-isoprostanes decreased Nitrosative stress Nitrotyrosine decreased DNA damage 8-hydroxydeoxy-guanosine decreased Scavanger enzymes SOD decreased, no change, increased CAT decreased, no change, increased GPx inverse relationship to CAT GR Non-enzymatic scavengers GSH GSH/GSSG ratio increased Ascorbic acid no changes or increased α-tocopherol no changes (α-toc/chol+tg)
Cycling of OX/RED forms Increased oxidative stress Reduced oxidative stress
Comparison of the oxidative stress measures by obese and nonobese persons
DECREASED CALORIC INTAKE(for obese or overweight individuals) diabetic rats Wistar: 9 wks fed: group A – hypocaloric diet group B – free diet in group A: decreased TNF-α, IL-1, IL-4, IL-6 increased antiinflammatory mediators and IL-10 Prevention of diabetic complications by supression of inflammation due to decreased oxidative stress Ugochukwu et al., J Nutr Biochem 2007, 18, 120-126
COMBINATION OF DIET AND PHYSICAL ACTIVITY Improved lifestyle in 19 children with overweight 2 wks: diet with reduced fat + increased fiber contents 2hrs daily physical training Results: decrease: cholesterol, TG, 8-iso-PGF-2, ICAM-1, selectin, CRP, myeloperoxidase, superoxide and H2O2 increase: NO Improved parameters associated with atherosclerosis risk Roberts CK et al., Atherosclerosis 191, 2007, 98-106
CALORIC RESTRICTION & OXIDATIVE STRESS Patients: A/ obese Type 2 diabetic patients (n=9) B/ obese non-diabetic patients (n=9) Methods: VLCD diet (600 kcal), 1 week Laboratory methods: FFA, ß-HB, MDA, SOD, ascorbic acid, alpha-tocopherol, T-chol, HDL, LDL-chol., TG
CALORIC RESTRICTION & OXIDATIVE STRESS Diabetic pts:Age 55 (41-70) yrs. DM duration 12 ± 5 r. BMI 36.2 ± 1.6 kg/m2 HbA1c 10.2 ± 1.6 % Controls:Age 53 (35-69) r. BMI 37 ± 2.1 kg/m2 HbA1c 5.5 ± 0.4 %
Low-calory diet Control persons 0,001
Low-calory diet Control persons 0,05 0,001
Low-calory diet Control persons 0,001 0,001
Low-calory diet Control persons 0,001 0,05
Low-calory diet Control persons 0,01
Low-calory diet Control persons 0,01 0,01
Low-calory diet Control persons 0,01
Low-calory diet 0,05
CALORIC RESTRICTION & OXIDATIVE STRESS Conclusions Caloric restriction lowers LDL and HDL-cholesterol and triglycerides Significant decrease of oxidative stress was found in obese non-diabetic pts (MDA decrease, SOD and ascorbic acid increase), these changes were only borderline in diabetic patients Obese diabetic patients are more resistant to low calory diet in comparison with obese non-diabetic patients and they reduce oxidative stress less than non-diabetic persons
a) Oxidative stress is higher in obese than in nonobese personsb) Very low calory diet decreases the level of oxidative stress