Download
1 / 12
120 likes | 214 Views
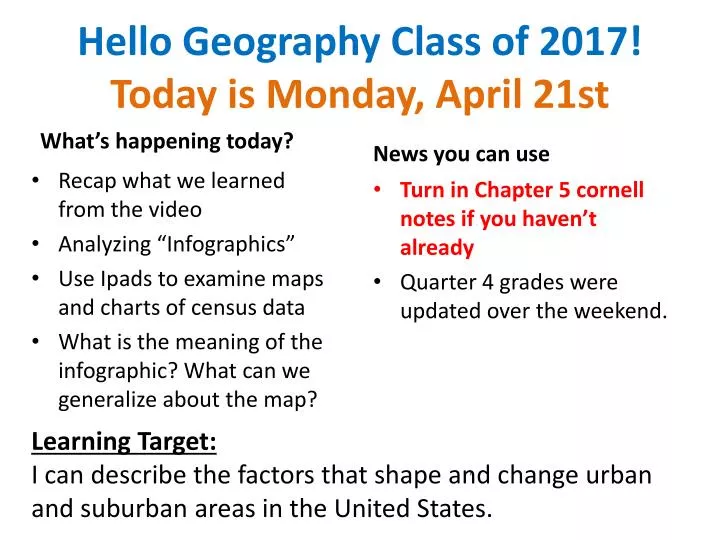
Hello Geography Class of 2017! Today is Monday, April 21st. What’s happening today?. News you can use. Turn in Chapter 5 cornell notes if you haven’t already Quarter 4 grades were updated over the weekend. Recap what we learned from the video Analyzing “ Infographics ”

E N D
Hello Geography Class of 2017!Today is Monday, April 21st What’s happening today? News you can use Turn in Chapter 5 cornell notes if you haven’t already Quarter 4 grades were updated over the weekend. • Recap what we learned from the video • Analyzing “Infographics” • Use Ipadsto examine maps and charts of census data • What is the meaning of the infographic? What can we generalize about the map? Learning Target: I can describe the factors that shape and change urban and suburban areas in the United States.
Visual Displays • What are the purposes of visual displays like the charts, maps, graphs, timelines, tables and other features known as “infographics”? • Why do many readers like infographics? • How can we evaluate an infographic? • What did the infographics make people understand that, say, a written version of the same data likely wouldn’t?
Bad Infographics biased
Confusing! • confusing
Title of Map or Graph Population by Race and Hispanic Origin Date or year 2012 and 2060 Creator of map United States Census Bureau Write 4 facts from the map/graph What is the meaning of the infograph?
Map 1: MINNEAPOLIS - ST PAUL 7-COUNTY REGION All Subsidized Housing by Project Site in 2012
Source: U.S. Census Bureau, Decennial Census 2000 (SF1 Corrected) and Decennial Census 2010 (PL Data).