Download
1 / 48
480 likes | 562 Views
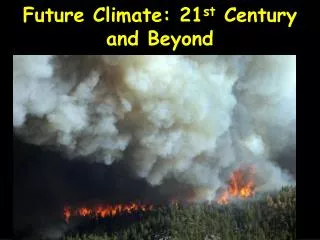
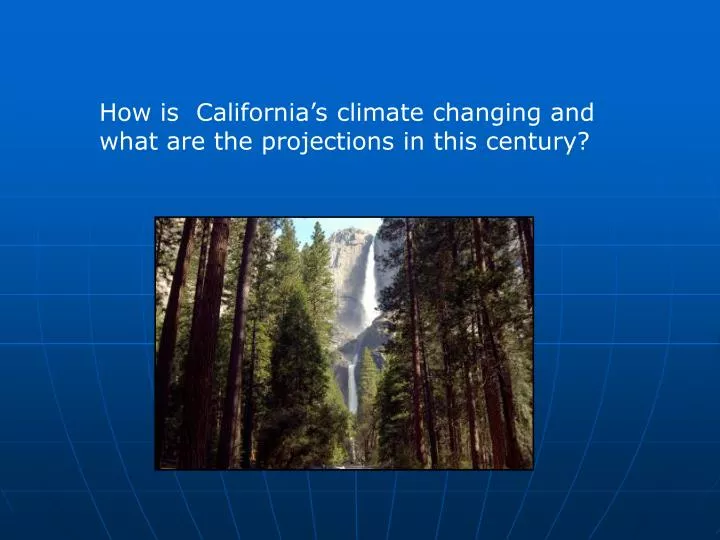
How is California’s climate changing and what are the projections in this century?. CALIFORNIA CLIMATE PROJECTIONS Temperatures: By end of century, temperatures between 3 and 10.5 degrees F higher than today. Precipitation:

E N D
How is California’s climate changing and what are the projections in this century?
CALIFORNIA CLIMATE PROJECTIONS Temperatures: By end of century, temperatures between 3 and 10.5 degrees F higher than today. Precipitation: Projections show little change in total annual precipitation; some models forecast slightly wetter winters; other models slightly dryer winters. Higher Temperature; Precipitation Forecasts Mixed
Higher Temperatures and Health Impacts Significant increase in the number of days conducive to ground level ozone formation Over 100 days possible with temperatures >90 deg F. by end of century
But Don’t Extreme Cold Days Have a Similar Impact on Mortality? No. They appear to have very different impacts. Researchers at the Harvard School of Public Health analyzed climate data and mortality records for the 6.5 million deaths that occurred in 50 U.S. cities from 1989 to 2000. During Cold Snaps Death Rates Increased by 1.59% During Heat Waves Death Rates Increased by 5.74% We seem better able to handle cold weather. Source: Mercedes Medina-Ramón and Joel Schwartz; Temperature, Temperature Extremes, and Mortality: A Study of Acclimatization and Effect Modification in 50 United States Cities; Occupational and Environmental Medicine. Published Online 28 June 2007.
Other Impacts on California: Water Resources • Water Resources: Significant reduction Sierra Nevada spring snow pack forecasted (70 to 90% in high emissions scenario; half that in lower emission scenario) • California population expected to increase from 35 million to 55 million by 2050; water resources nearly fully utilized already • By end of the century, late spring stream flow could diminish by up to 30%; agriculture particularly hard hit. • Potential reduction in hydropower (currently 15% of electricity generation)
Other Impacts on California Agriculture • California produces 50% of all US fruits and vegetables; Increasing temperatures can increase plant growth (to a point) but can also diminish the quality of the produce. • Industries likely to be impacted: • Wine Grapes • Fruits and Nuts • Milk Production • Warmer temperatures can increase crop damaging pests and pathogens • Water availability challenges
Why is it important that we act now to reduce our greenhouse gas emissions?
The U.S. emits about 6.4 billion metric tons of greenhouse gases annually, 25% of the world’s total. 6.4 billion metric tons CO2/yr These greenhouse gases last a long time… Carbon dioxide stays in the atmosphere for approximately 100 years, methane lasts about 12 years. Other greenhouse gases last even longer. Warming begets more warming… As these gases continue to raise surface temperatures, they trigger the release of even greater quantities of carbon dioxide and methane that are currently trapped in frozen Arctic permafrost and tundra soils, further increasing temperatures. A feedback mechanism ensues… …potentially causing “runaway global warming”.
There is a concern among scientists that we may only have 10 to 20 years to significantly reduce our emissions of greenhouse gases or we could reach a “tipping point” where it will be too late to slow global warming.
This Map Made a Lasting Impression Year 2095 Temperature Changes (Temperature changes from the 1961-1990 average) What could I do to slow climate change? I did a lot of reading…
Households are Big Contributors to Climate Change • Of all U.S. greenhouse gas emissions come from households: • Vehicles • Home Heating • Electricity 40 %
Reduce our consumption of fossil fuels Because greenhouse gas emissions are tied very closely to our energy consumption, using less fossil fuel based energy puts fewer greenhouse gases into the atmosphere. This will help slow global warming. Mountaintop removal for coal mining near Rawl, West Virginia. 50% of electricity in the United States is produced from coal. (photo Kent Kessinger)
There are many ways we can use less energy We can drive smaller, more fuel efficient cars and use cars less often: = 36 MPG = 6,500 pounds CO2 per year = 23 MPG = 10,200pounds CO2 per year = 13 MPG = 18,059pounds CO2 per year (Estimates based on US average of 12,000 miles/year)
Replacing just 1 incandescent light bulb with 1 compact florescent bulb saves about 150 pounds of carbon dioxide per year! We can make some simple substitutions If every American household replaced just 5 high-use incandescent bulbs with compact florescent lights we'd collectively save more than $8 billion each year in energy costs and we would prevent the greenhouse gases equivalent to the emissions from nearly 10 million cars. Source: http://www.energystar.gov
Look for the Energy Star • In 2004 Americans using Energy Star products: • Avoided Emissions = 20 million cars • Energy Saved = 24 million homes • Saved $10 billiondollars Source: http://www.energystar.gov
5 things that require tons of energy and can produce tons of carbon dioxide • Vehicles • Heating Systems • Clothes Dryers • Dehumidifiers • Refrigerators/Freezers A typical dehumidifier costs $275/yr to operate and produces 2000pounds of carbon dioxide per year. Prioritize energy efficiency in these items!
Stop the Snacking! • Some appliances and electronic devices are never truly “off”; they continue to draw electricity even when they aren’t being used. • Stop them from snacking on your electricity and wasting your money! • Use a UL power strip and turn the power strip off when not in use. Note Some electronics can use up to 30% of their electricity requirements even when they are “OFF”
Small changes really add up Replace your old refrigerator with a new Energy Star: Annual savings: $90; 700 pounds CO2 Set your thermostat down a few degrees in the winter Annual savings: $135; 1400 pounds CO2 Drive JUST 10 fewer miles per week Annual savings: $80; 520 pounds CO2 Reduce your garbage by 10% through greater recycling or reduced packaging Annual savings: 1200 pounds CO2 Wash clothes in cold water only Annual savings: $70; 500 pounds CO2 Caulk and weather-strip around doors and windows Annual savings: $80; 650 pounds CO2 * These are mid-range estimates from published sources; your savings may vary.
More household ideas… Use a Clothesline: Electric dryers use tons of energy and produce tons of CO2! Consider replacing your vehicle with a more fuel efficient car (10 MPG higher). Save 4300 pounds of CO2 and $660 per year. Shop Locally!
Put your kids on the bus rather than drive them to school You’ll save 3600 pounds of CO2 per year and $540 a year. The school bus: it takes our children away and returns them safely several hours later. WE LOVE IT! (Estimate based on 20 miles/day for 180 school days)
Use Biodiesel:put your oil furnace or boiler on a carbon diet Use biodiesel (bioheat B5) a mixture of 95% #2 fuel oil and 5% biofuels (soybean based). Requires no retrofitting of existing equipment. Expected to have ASTM approval by Fall, 2007 Reduces CO2 emissions by 708 pounds per year. Soybeans Assumes 800 gallons fuel oil used per year. 4% reduction in CO2 for B5
We are promoting these and other residential actions that can be taken to reduce greenhouse gas emissions through the NH Carbon Challenge. The “Challenge” is for all 476,000 households in NH to reduce their CO2 emissions by 10,000 pounds per year.
And after you take the Carbon Challenge you can tell everyone…
Our take-home message… Each of us must take steps to protect our Earth's climate.
Summarizing my carbon reductions since 2005 70 CFL Bulbs: 10,500 pounds CO2/yr Driving 780 fewer miles(15 miles/week) a year 500 pounds CO2/yr Reduced oil consumptionby 200 gallons/year (morewood heat) 4,000 pounds CO2/yr Lowered thermostat a few degrees in winter 1,000 pounds CO2/yr Switched to cold water when washing clothes 500 pounds CO2/yr ________________________________________ TOTAL REDUCTION 16,500 pounds CO2/yr And I’m saving OVER $250 on my electric bill annually! 29% less
Climate Change Stabilization Requires Action at all Scales • Individual – many actions are possible • Municipal – 620 US cities representing over 67 million Americans have signed the US Mayors Climate Protection Agreement pledging emissions reductions
Action From the States States with Greenhouse Gas Inventories States with Climate Change Action Plans California is Leading the Way!
States with Renewable Portfolio Standards Regional Agreements
Businesses Understand that Using Energy More Efficiently Reduces Costs and Greenhouse Gas Emissions “I am convinced that it is prudent to take action now to address what we do know (about climate change).” James E. Rogers, CEO Cinergy
EVERYONE Climate change stabilization requires action from While individuals… Municipalities… States… Regional entities… and many other countries are taking action…
This has been our federal government’s climate change policy: New Hampshire residents got tired of waiting…
182 ..we placed on the ballots in towns throughout NH a resolution calling for federal and local action on climate change. And what was the response from New Hampshire?
Loud and Clear! 164 towns endorsed the resolution! (90%) towns did not endorse the resolution (7%) towns tabled the resolution (3%) 13 5
New Hampshire Climate Change Resolution To see if the town will go on record in support of effective actions by the President and the Congress to address the issue of climate change which is increasingly harmful to the environment and economy of New Hampshire and to the future well being of the people of ____________. These actions include: • Establishment of a national program requiring reductions of U.S. greenhouse gas emissions while protecting the U.S. economy. 2. Creation of a major national research initiative to foster rapid development of sustainable energy technologies thereby stimulating new jobs and investment. In addition, the town of __________ encourages New Hampshire citizens to work for emission reductions within their communities, and we ask our Selectmen to consider the appointment of a voluntary energy committee to recommend local steps to save energy and reduce emissions. www.carboncoalition.org
With our first-in-the-nation primary, New Hampshire residents can impact the tone and issues of the next Presidential election. Let’s make sure the Presidential candidates understand we want ACTION on climate change!
What About the Naysayers??? To those people who insist that we can’t reduce our greenhouse gas emissions because our economy is simply too fossil fuel based and renewable energies can’t meet our energy demand I’ve got this question…
“What have we ever created, developed, invented, engineered, and patented that ever began with the assumption that ‘This will NEVER work. This just CAN’T be done.’ ”
Do you think this happened? Wilbur: “Wow, this flying thing is WAY harder than I thought.” Orville: “Yeah, let’s just quit.”
If we take an historical perspective we have met major environmental challenges in the past: 25 yearsago 20 years ago 40 years ago Now OZONEDESTRUCTION CLIMATE CHANGE SMOG ACID RAIN Solution: catalytic converter(US invention) Solution: Montreal Protocol CFC phaseout (US key participant) Solution: a market-based “cap and trade” system for regulating utility SO2 emissions (US creation) Solution: households, industry, & governmentworking together • Smog reduced by one-third to one-half • CFCs all but eliminated, ozone layer appears to be (slowly) rebounding • Acid rain emissions cut by a third; forests rebounding Since then: In all of these cases, reductions in pollutants were muchcheaper and occurred much faster than anticipated! We CAN meet the challenge and reduce the risk of climate change!
Electricity end-use efficiency Improved Building and Industrial Efficiency Passenger vehicle efficiency Other transport Efficiency (“smart growth” transportation planning; mass transit) Renewables CCS and Supply efficiency Using Current Technologies We Can Significantly Reduce Our Emissions Giving Us “Breathing Room” to Transition to a (Hydrogen?) Fueled World 3 2.6 2.5 2 1.8 GtC 1.5 1 0.9 0.5 0 1970 1990 2010 2030 2050 Source: Pacala and Socolow, 2004
The United States is well positioned to create many of the technologies and products needed to transition to a low carbon energy world. • Technologies are particularly needed in China and India. • New jobs and new industries will be created We just need to get going! www.ecogeek.org
In Conclusion… It’s up to us How our climate changes in this century really depends on us. The energy choices we make today will largely determine the climate we have tomorrow. Roger Stephenson photo
Thank-you! http://carbonchallenge.sr.unh.edu
References: Slide 4: Average Temperature on Earth without Greenhouse Gases. Source: Vital Climate Graphics: http://www.vitalgraphics.net/climate2.cfm?pageID=6 Slide 9: Oceans and Climate Change. Source: The Oceanic Sink for Anthropogenic CO2 ScienceScience 16 July 2004 [http://www.sciencemag.org/cgi/content/abstract/305/5682/367] and NASA Facts: The Roles of the Ocean in Climate Change [http://earthobservatory.nasa.gov/Newsroom/MediaResources/Roles_Ocean.pdf] Slide 10: Thermohaline Circulation. Source: NASA Facts: The Roles of the Ocean in Climate Change [http://earthobservatory.nasa.gov/Newsroom/MediaResources/Roles_Ocean.pdf] Slides 12 Ice core image from An Inconvenient Truth. p. 65 Slides 13-16: EPICA Ice Core. Source: An Inconvenient Truth. pp. 66-67. Slide 17: Keeling Curve. Source: NOAA Climate Monitoring and Diagnostic Laboratory (CMDL) Slide 18: CH4 and N2O since Industrial Revolution. Source: IPCC: http://www.ipcc.ch/present/graphics/2001syr/large/02.01.jpg Slide 20: Temperature Changes in 1995. Source: NCAR Community Climate System Model, version 3 (CCSM3) Data available through EOS-WEBSTER http://www.eos-webster.sr.unh.edu Slide 22: Human Population. Source: An Inconvenient Truth. pp. 216-217. Slide 23: Carbon Dioxide Projections. Vital Climate Graphics. Source: http://www.vitalgraphics.net/graphic.cfm?filename=climate2/large/14.jpg Slide 24: Temperature Change Projections for 2100. NCAR Community Climate System Model, version 3 (CCSM3) Data available through EOS-WEBSTER http://www.eos-webster.sr.unh.edu Slide 27: Climate Impacts. Vital Climate Graphics http://www.grida.no/climate/vital/20.htm Slides 28-29 Arctic Climate Impact Assessment. 2004. Impacts of a Warming Arctic; http://amap.no/acia/ Slide 31: Source: An Inconvenient Truth. P. 145 Slides 32-34 Weiss and Overpeck; University of ArizonaSlides 35-36 San Francisco Bay Conservation and Development Commission; http://www.bcdc.ca.gov/index.php?cat=56
Slide 37: Al Gore, An Inconvenient Truth. pp. 108-109 Slide 38: Al Gore, An Inconvenient Truth. pp. 116 Slide 39: Al Gore, An Inconvenient Truth. pp. 120 Slide 40: Al Gore, An Inconvenient Truth. pp. 156-157 Slide 42: Union of Concerned Scientists, Global Warming in New Hampshire Slide 43-46: Northeastern Climate Impact Assessment, The Changing Northeast Climate Slides 51-52 and Slides 53-54: California Climate Change Center; Our Changing Climate: Assessing the Risks to California Slide 63: Carbon Dioxide from Vehicles. Toyota Corolla, Camry, and Land Cruiser MPG estimates from http://www.fueleconomy.gov/ Slides 77-79: Pew Center on Global Climate Change; http://www.pewclimate.org Slide 89: Image from the North Carolina Division of Archives and History Slide 90: Some Convenient Truths. Atlantic Monthly (September, 2006) Slide 91: S. Pacala and R. Socolow. Stabilization Wedges: Solving the Climate Problem for the Next 50 Years with Current Technologies Science (August 13, 2004; Vol. 305) Special thanks to Dr. Steve Frolking, Dr. Rob Braswell, and Dr. Annette Schloss for reviewing this presentation and making numerous helpful suggestions. July 27, 2007