Download
1 / 2
20 likes | 110 Views
Greenhouse Gases. Original Source: . In 1958 John David Keeling began monitoring CO2 concentrations at the US Weather Bureau observatory on Mauna Loa, Hawaii. This now-famous

E N D
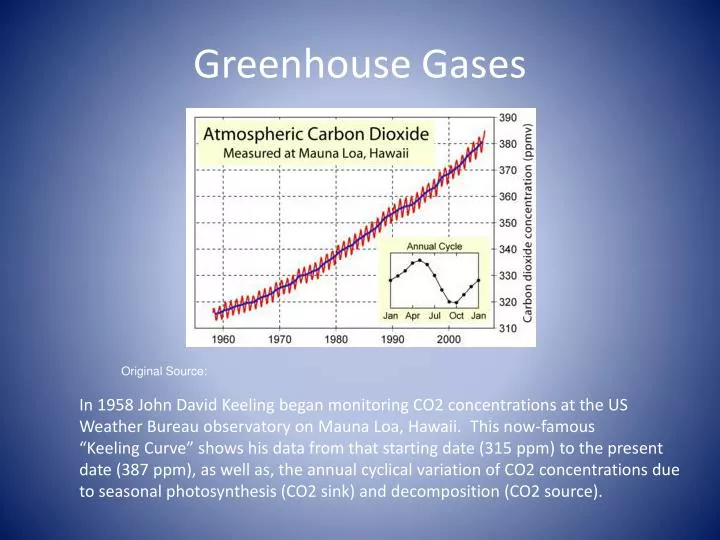
Greenhouse Gases Original Source: In 1958 John David Keeling began monitoring CO2 concentrations at the US Weather Bureau observatory on Mauna Loa, Hawaii. This now-famous “Keeling Curve” shows his data from that starting date (315 ppm) to the present date (387 ppm), as well as, the annual cyclical variation of CO2 concentrations due to seasonal photosynthesis (CO2 sink) and decomposition (CO2 source).
Global Carbon Emissions 2004 How much CO2 is too much? Climate experts are now evaluating certain biogeochemical systems to determine if “tipping points” have been reached .