Download
1 / 54
540 likes | 631 Views
DATA (Not Just a Lot of Numbers). James Stewart Lothar Redlin Saleem Watson. College Algebra A Course in Crisis?. Introductory collegiate mathematics is in the midst of a revolution… - Nancy Baxter Hastings, Dickinson College

E N D
DATA (Not Just a Lot of Numbers) James Stewart Lothar Redlin Saleem Watson
College AlgebraA Course in Crisis? Introductory collegiate mathematics is in the midst of a revolution… -Nancy Baxter Hastings, Dickinson College Traditional College Algebra is a boring, archaic, torturous course that does not help students solve problems or become better citizens. It turns off students and discourages them from seeking more mathematics learning. - Chris Arney, Dean of Science and Mathematics, St. Rose College
College AlgebraA Course in Crisis? NSF conference on “Rethinking the Courses Below Calculus” in Washington D.C in 2001. Some of the major themes to emerge from this conference: • Spend less time on algebraic manipulation and more time on exploring concepts • Reduce the number of topics but study those topics covered in greater depth • Give greater priority to data analysis as a foundation for mathematical modeling • Emphasize the verbal, numerical, graphical and symbolic representations of mathematical concepts
WHY DATA? Over the past two decades computers have transformed public discourse by generating piles of data and myriad analyses of these data. Ordinary citizens must deal with numbers and data every day. -Bernard Madison, University of Arkansas Virtually any educated individual will need the ability: 1. to examine a set of data and recognize a behavioral pattern in it,2. to assess how well a given functional model matches the data,3. to recognize the limitations in the model,4. to use the model to draw appropriate conclusions,5. to answer approriate questions about the phenomenon being studied.-Sheldon Gordon, Farmingdale State University of New York
WHY DATA? • Data relate the real world and algebraic equations. • Students can collect data and make models from data. • Students can see how the model gives us information about the thing being modeled.
WHY DATA? Greater Depth: Connecting the Concepts
WHY DATA? Greater Depth: Connecting the Concepts
WHY DATA? Greater Depth: Connecting the Concepts
COLLECTING DATA • From classmates (measurements) Age, height, hand span, shoe size, hat size
COLLECTING DATA • Survey • What is the value (in cents) of the coins in your pocket or purse? __________ • How far is your daily commute to school (in miles)? _________ • How many siblings do you have (including yourself)? __________ • How many hours a week do you spend on the Internet? __________ • How many hours a week do you spend on homework? ________ • Rate your happiness. • not happy happy very happy • Rate your satisfaction with your school work. • not satisfied satisfied very satisfied • From classmates (Surveys)
COLLECTING DATA • From simple experiments • Bridge science
COLLECTING DATA • From simple experiments • How quickly can you name your favorite things • How many words can you recall from a memorized list (after a day, a week, a month). Listing vegetables Memorizing a list
COLLECTING DATA • From simple experiments • How quickly does water leak from a tank? Toricelli’s Law Toricelli’s Law The experiment Students performing the experiment
COLLECTING DATA • From simple experiments • Radioactive decay—modeled with pennies Radioactive Decay Coin Experiment
COLLECTING DATA • From the Internet • How many farms in the US? Farming in the 20th century Farming in the 19th century
COLLECTING DATA • From the Internet • Population Las Vegas 1900 Las Vegas 2000
COLLECTING DATA • From Journal Articles • Algebra and Alcohol Concentration (mg/ml) after 95% ethanol oral dose
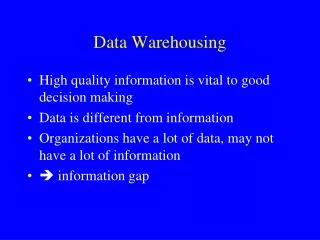
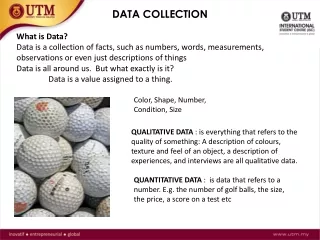
Getting Information from Data • Descriptive Information Tells us something about the data itself • Inferential Information Tells us how to extend the information obtained from the data beyond the domain of the data.
The FORM of the Data How does the data obtained from this survey differ for different questions? • What is your age? • What is your height? • What is your hair color? • From which source do you mostly obtain the news? • Do you believe that the Universe began in a huge explosion?
The Form of the Data The form of the data tells us the kind of information we can obtain. • One-Variable Data • Two-Variable Data • Categorical Data • Sample Data
One-Variable Data Descriptive Information • Summary statistics: Central tendency: Mean, median Dispersion: variance, standard deviation
One-Variable Data Example: height of students Mean: 60”, S.D.: 10” Given this information, which picture is more likely?
One-Variable Data Descriptive Information • Frequency histogram Graphical, gives more complete information—tells how the data is distributed.
One-Variable Data Descriptive Information • Frequency histogram
Two-Variable Data Descriptive Information • Scatter plot Gives description of the relationship between the variables. • Regression Line (or other curve) Gives the curve that best fits (or best describes) the data
Two-Variable Data Descriptive information • Depth/Pressure Data
Two-Variable Data Descriptive information • TV Hours/BMI
Two-variable data(Goal: Find a relationship between the variables) Two-Variable Data Descriptive Information • Regression Line (or other curve) Gives the curve that best fits (or best describes) the data Depth / Pressure Hours TV / BMI
Two-variable data(Goal: Find a relationship between the variables) Two-Variable Data Inferential Information • Regression Line (or other curve) Use the curve to get information not in the data (extrapolation or interpolation using the regression curve).
Two-variable data(Goal: Find a relationship between the variables) Two-Variable Data Inferential Information • Regression Line (or other curve)
a Two-Variable Data Descriptive information • Tire Inflation-Tire Life Relation • Quadratic functions
a Two-Variable Data Descriptive information • Species-Area Relation • Power functions
a Two-Variable Data Descriptive information • Length-at-Age Relation • Polynomial functions 90 year old rock fish
Two-Variable Data Descriptive information • Algebra and alcohol • Surge Functions Concentration (mg/ml) after 95% ethanol oral dose
Categorical Data Results of survey: These data need organizing!
Categorical data(Goal: Organize the data/Get information) Categorical Data Descriptive information • Organize Data in a Matrix
Categorical data(Goal: Organize the data/Get information) Categorical Data Descriptive information • Organize Data in a Proportionality Matrix
Categorical data(Goal: Organize the data/Get information) Categorical Data Get information from the data • Using matrix multiplication
Categorical data(Goal: Organize the data/Get information) Categorical Data Get information from the data • Using matrix multiplication
Sample Data We sample the wine. (We don’t drink the whole bottle and then decide that the wine is no good.)
GOAL: Get Information from Data Get information about a population from a sample.
Sample Data • No information if the sample is not random Example: Samples of height Take sample from the basketball team Example: Proportion of male to female students Take sample from the girls dormitory • No information if the sample size is too small Example: A sample of one
Intuitive basis for inference from a sample Examples • Hypothesis: Equal number of male and female students A random sample of 30 students are all female Conclusion: Reject hypothesis • Hypothesis: A coin is fair The coin is tossed 20 times and results in 20 heads Conclusion: Reject hypothesis
Intuitive basis for inference from a sample Alternate examples • Hypothesis: Equal number of male and female students A random sample of 30 students, 21 are female Conclusion: Reject hypothesis? • Hypothesis: A coin is fair The coin is tossed 20 times, 16 heads Conclusion: Reject hypothesis?
Statistical basis for inference from a sample How do we make these intuitive decisions? Because we know that some events are less likely than others. We intuitively “know” the probability distribution of certain events. • Tossing 30 coins is a binomial distribution • The average height of male students in samples of 500 students is a normal distribution.
Statistical basis for inference from a sample • For more refined estimates we need to know the probability distribution more accurately. Decision Rule: If the probability of getting the sample we actually got (or a more extreme sample) is very small (say .05 or less), we reject our hypothesis.