Download
1 / 16
160 likes | 264 Views
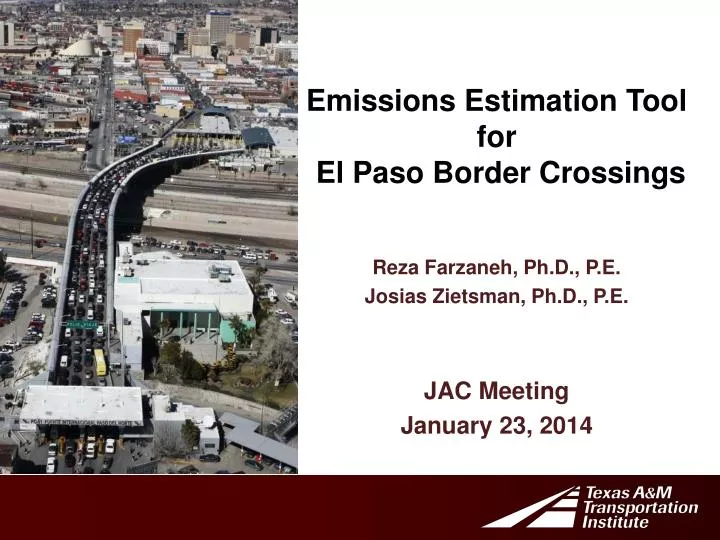
Emissions Estimation Tool f or El Paso Border Crossings. Reza Farzaneh, Ph.D., P.E. Josias Zietsman, Ph.D ., P.E. JAC Meeting January 23, 2014. Project Overview. Goal: Developing a MOVES-based emission estimation tool based on real-world border crossing data

E N D
Emissions Estimation Tool for El Paso Border Crossings Reza Farzaneh, Ph.D., P.E. Josias Zietsman, Ph.D., P.E. JAC Meeting January 23, 2014
Project Overview Goal: Developing a MOVES-based emission estimation tool based on real-world border crossing data • All data from El Paso-Juarez international bridges • A four-step process to achieve the goal of the study • Easy-to-use spreadsheet-based structure
Step 1. Data Collection Protocol • Data collection plan • Data processing methods • Quality control procedures Technical Approach • Step 2. Data Collection • GPS data (cars and trucks) • Fuel samples (US and Mexico) • License plate records (cars and trucks) Preparations Literature review and information collection Identifying potential data sources • Step 3. Data Processing • Northbound and southbound trips • Fuel characteristics • Vehicle classification and age • Quality control • Step 4. Development of Emission Estimation Tool • OpMode-based emission rates from MOVES • Drive schedules from GPS data • Option to modify inputs for various scenarios • Validation
Step 1. Data Collection Protocol • Data collection plan • Target vehicles: • HDD drayage (source type 61) • LD vehicles (source types 21 & 31) • Parameters to be collected • Data collection methods • Necessary paperwork and authorizations • TAMU IRB, U.S. CBP, Texas DPS • Data processing and quality control procedures • Developed from previous studies • Documented in details in QAAP
Step 2. Data Collection • Vehicle activity data using GPS technology • HDD drayage – trucks from a drayage company • Light-duty vehicles – data collection by TTI staff assigned to different bridges and times of day • Fleet characteristics (vehicle type and age) • License plate recording (more than 11,000 vehicles) • Fuel characteristics • 20 samples: 5 for each fuel type/location combination • Sent to SwRI for fuel analysis
Step 3. Data Processing • Vehicle classification and age distributions • Texas DMC, Chihuahua’s Recaudador de Rentas, Secretaría de Comunicaciones y Transportes • Age distribution tables for the target vehicle types • Vehicle type split summary tables • Fuel characteristics • Fuel tables for MOVES (El Paso and Juarez) • Vehicle activity • GIS processing to extract sec-by-sec speed profile of border crossing trips by • Location & Direction • Time of day • Day of week
Step 3.Border Crossing Trips Ysleta-Zaragoza Bridge of the Americas
Step 3.Summary of Trips BOTA - Light Duty BOTA - Heavy Duty
Step 4. Building Estimation Tool (1) • Structure independent from data • Easy to update • MOVES-based calculations • Vehicle activity: operating mode (opMode) bins • Emission rates: rates for each opMode bin
Step 4. Building Estimation Tool (2) • High level of flexibility • Standalone Excel-based • Input parameters by direction and vehicle location • Traffic volume • Speed • Time of day traffic distribution • Vehicle age profile • Default values based on collected data • Age distributions and vehicle activity profiles • User can modify these parameters
Case Study Application (1) • Case study 1: future projections
Case Study Application (2) • Case study 2: drayage truck replacement
Thank You! Reza Farzaneh, Ph.D., P.E. Tel. (512) 407-1118 Reza.Farzaneh@tamu.edu Josias Zietsman, Ph.D., P.E. Tel. (979) 458-3476 Zietsman@tamu.edu