Download
1 / 29
290 likes | 424 Views
Facility Effectiveness Assessment Tool. CGSA Conference 2014 San Diego, CA. Department of General Services County of San Diego. Portfolio Management. <30 years. 30 to 50. >50 years. Area in sq ft. Non-Historic 902.7 ksf. Historic 641 ksf. Year of measure. 2.

E N D
Facility Effectiveness Assessment Tool CGSA Conference 2014 San Diego, CA • Department of General Services • County of San Diego
Portfolio Management <30 years 30 to 50 >50 years Area in sq ft Non-Historic 902.7 ksf Historic 641 ksf Year of measure 2
A basis for strategic facilities decisions • Recapitalization - Replacement of building subsystems • Renewal - Improvement, addition or expansion of facilities • Replacement - Relocation or new construction 3
Implementation • Capital Improvement Plan (CIP) - Short-range plan of capital projects linking the county’s comprehensive and strategic plans and its annual budget. Achieved through Capital Improvement Needs Assessment. • Strategic Facilities Plan- Organization’s business objectives over 10-20 years to determine short-term tactical plans (CIP, MMIP). 4
Facilities Performance • Possible tools for considering facilities performance: • Facilities Condition Index • Maintenance deficiencies ($) divided by Current Replacement Value • Comparative indicator of relative facilities conditions • Facilities Operations/CRV Index APPA FPIs.pdf • Annual facilities operating cost divided by Current Replacement Value • Level of funding provided for the stewardship responsibility of the county’s annual facilities operating expenditures • Facilities Operations/GSF Index APPA FPIs.pdf • Annual facilities operating cost divided by Gross Square Feet • Level of funding provided for the stewardship responsibility of the county’s general capital assets • Facilities Operations/GCE APPA FPIs.pdf • Annual facilities operating cost divided by Gross County Expenditures • Level of funding provided for the stewardship responsibility of the county’s general capital assets 6
Facilities Performance • Capital Renewal Index APPA FPIs.pdf • Annual renewal/renovation/modernization expenditures (MMIP) divided by current replacement value • Level of funding provided for the renewal/renovation/modernization needs • Needs Index APPA FPIs.pdf • Capital renewal and needs backlog plus renovation/modernization need divided by Current Replacement Value • Overall indicator of facilities condition. Influenced by resource availability and utilization • Cost Per Person GSA Creates New Performance Models for Cost and Effectiveness.pdf • Annual facility operating costs per square foot times number of square feet per person. • Operating costs include rental cost or maintenance/utilities cost plus IT and telecommunications cost per work station plus work station furniture (life cycle cost) plus alternative work environment considerations. • Alternative Work Environment considerations developed by GSA (1999) 7
Facilities Performance • Post-Occupancy Evaluations/ Building Performance Evaluations…Facility Performance Evaluation (FPE) Whole Building Design Guide.mht • Conveys the characteristics of buildings that work well and best, and identifies the ones that should not be repeated in future designs of buildings • Often aligned with LEED rating system • Short-term benefits are related to immediate design decisions, and facility maintenance and management issues • Medium-term (3- to 5-yr period) benefits are related to generating useful information for future projects, and • Long-term (10- to 25-yr period) benefits are related to improving the long-term performance of buildings and to justifying major expenditures • All are related to building functionality only. • Need more measurement points. 8
Affinity Grouping Performance Indicators • Program/Function Efficiency (Public image and reputation, collaboration with community service partners, coordination with municipal services, appropriate services, work life quality, psychological and social well being • Staffing ratios • Employee survey • Client survey • Efficiency of services (?) • SF/FTE or FTE/SF • Facility Attributes (Work space efficiency, flexible/adaptable, adequate space) • FCI • CM/PM ratio • Age- • 1) New, old, historical; • 2) Code compliant • Original or expansion 10
Affinity Grouping Performance Indicators • Site/Location (Convenient location, public access and way finding, safe and secure) • Parking spaces • Public Transportation • Cost Effectiveness (Value of property, life cycle costing) • O&M $/SF • O&M $/FTE • Rent $/SF • Energy $ 11
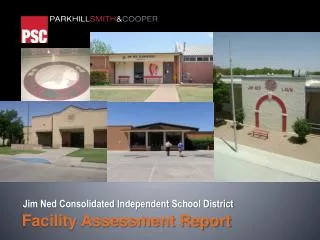
Process • Strengths, Weaknesses, Opportunities, Threats – SWOT Analysis • Working with HHSA, a team of various staff functions performed SWOT Analysis on several HHSA facilities- 3 Family Resource Centers, Adoption Center, Child Services Center. • All 2-story office buildings • Between 20,000 and 50,000 SF • Between 5 and 50 years old. • Team members • HHSA Facilities Manager • General Services Capital Planning staff • General Services Real Estate Services staff • General Services Facilities Operations staff • General Services Space Planning staff • General Services Financial Management staff 12
Program Quadrant • Program Attributesscore – • Space Utilization- Max-30 • Good 25 -30 • Average 15-25 • Fair 5-15 • Poor <5 • Logistical- Max- 20 • Good 15-20 • Fair 10-15 • Average 5-10 • Poor <5 • Environmental- Max- 20 • Good 15-20 • Fair 10-15 • Average 5-10 • Poor <5 • Safety- Max-30 • Good 25 -30 • Average 15-25 • Fair 5-15 • Poor <5 16
Facilities Quadrant • Facilities Attributes score – • FCI (Deficiency $/Replacement Value) • 0.0-0.05- Good 30 • > 0.05-0.10- Fair 15 • > 0.10- Poor 5 • CM/PM <3.0 (Corrective Maint Hrs/Preventive Maint Hrs)- Indices of effectiveness of Preventive Maintenance program • <3.0 Good 30 • 3.0-5.0 Fair 20 • >5.0 Poor 10 • Space standards (Avg 210 SF/FTE) • Avg +/- 10% of county standard Good 20 • Avg >10%<20% of county standard Fair 15 • Avg >20%+/- county standard Poor 5 • Age • Under 25 years Good 20 • 25-40 Fair 10 • >40 Poor 0 • Or • Can Meet ZNE requirement? • Yes Good 20 • Yes with improvements Fair 10 • No Poor 0 17
Financial Quadrant • Financial Attributes score – • EUI Rating- xx.x ; yy.y >National Median • 75%-100% Greater 25 • 50%-75% Greater 15 • 25%-50% Greater 10 • <25% Greater 5 • O&M/CRV (annual CM+PM+MM $/Current Replacement Value) • < 4.0 % Good 25 • 4.0-6.0 % Fair 15 • >6.0 % Poor 0 • Benchmark O&M (Whitestone Facility Operations Cost Reference)/ Actual Bldg O&M • 0.0-0.5 Good 50 • 0.5-1.0 Fair 25 • > 1.0 Poor 0 • Or • Rent $/SF (subject to regional market benchmarks-$BM/SF) • Under $BM/SF- Good 50 • >$BM/SF<$1.25xBM/SF Fair 30 • >$1.25xBM/SF Poor 0 18
Site Quadrant • Site Attributes score – • Current Use Permit Valid – Y 15 • N 0 • Sufficient parking for Staff- Y 10 • N 0 • Clients- Y 10 • N 0 • Location favorable for- Workforce Y 10 • N 0 • Clients Y 10 • N 0 • Safe/secure location Y 10 • N 0 • Public transit available Y 10 • N 0 • Potential disposition: Expansion 15 • Resale opportunity 10 • Constrained 0 • Compatible affinities near-by Y 10 • N 0 19
Dashboard 20
Ohio St. Adult Probation Services • 52 year old 22,200 SF structure; 106 staff with over 37,800 clients/visitors annually • 2 floors, limited ADA accessibility on 1st floor only • Limited parking • Neighborhood undergoing revitalization and growth • $500K major internal space remodel need identified • Changes in program delivery methods since original construction
Ohio St. Adult Probation Services • Several options for evaluation • Demo existing, rebuild on site: • Concerns- Limited parking on site; changing community, existing zoning; interim lease facilities needed during construction; longer project time • Favorable- Existing use permit; new sustainable building; program delivery efficiency; centrally located • Remodel existing building: • Concerns- Changing community, existing zoning; interim lease facilities needed during construction; parking still a problem; Longer project time • Favorable- Centrally located; ; new sustainable building; program delivery efficiency • Acquire land, build new: • Concerns- Location (availability, cost, zoning/use permit) • Favorable- New sustainable building; program delivery efficiency; adequate parking; dispose existing Ohio St site 25
Ohio St. Adult Probation Services • Buy new building: • Concerns- Location (availability, cost, zoning/use permit) • Favorable- Program delivery efficiency; adequate parking; dispose existing Ohio St site • Lease existing facility: • Concerns- Location (availability, cost, zoning/use permit); TI cost; • Favorable- Program delivery efficiency; adequate parking; dispose existing Ohio St site • Public-Private Partnership • Concerns- Location (availability, cost, zoning/use permit); financing availability • Favorable- Developer assumes risk; dispose existing Ohio Street site • Recapitalize existing building • Concerns- Community opposition; ADA upgrades may impact efficient space utilization; lack of parking • Favorable- Less expensive;
Recommendation • Real Estate Services be authorized to initiate site search for purchase of land or structure. Search area compatible with client distribution mapping • For vacant site, develop project for new construction of 22,200 SF facility. • ROM- Land $2.0-$3.0 M • Total Project $6.9 M (Construction $5.1 M) • 2. For existing facility, develop project for rehab and improvement to meet program requirements. • ROM- Building $4.0-$6.0 M • TI’s $1.4-$1.8 M • Include Project in FY 15/16-19/20 Capital Improvements Need Assessment for Board approval in Spring 2015
Next Steps • Refine and validate measures • Validate surveys questions across several departments • Gather facility metrics and validate consistent basis • Socialize the tools with departments • Expand pilot program for the FY15-16 Capital Program
Facility Effectiveness Assessment Tool CGSA Conference 2014 San Diego, CA • Department of General Services • County of San Diego