Download
1 / 33
330 likes | 455 Views
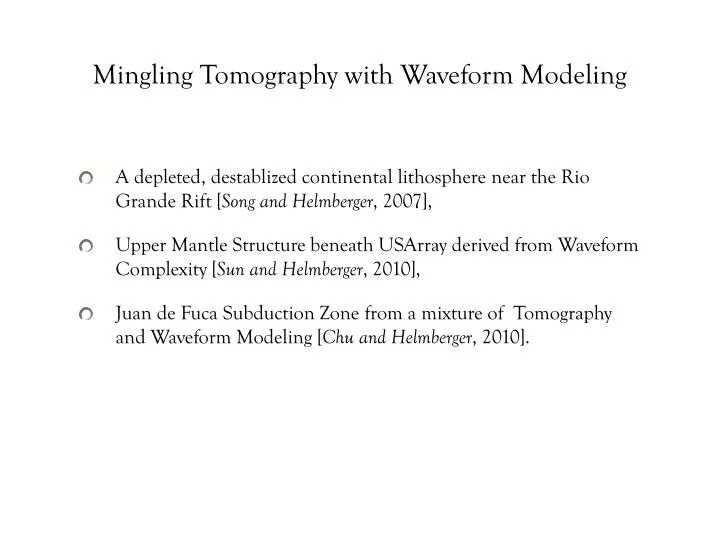
Mingling Tomography with Waveform Modeling. A depleted, destablized continental lithosphere near the Rio Grande Rift [ Song and Helmberger , 2007], Upper Mantle Structure beneath USArray derived from Waveform Complexity [ Sun and Helmberger , 2010],

E N D
Mingling Tomography with Waveform Modeling • A depleted, destablized continental lithosphere near the Rio Grande Rift [Song and Helmberger, 2007], • Upper Mantle Structure beneath USArray derived from Waveform Complexity [Sun and Helmberger, 2010], • Juan de Fuca Subduction Zone from a mixture of Tomography and Waveform Modeling [Chu and Helmberger, 2010].
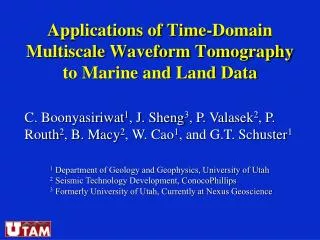
Tomographic model of Western US P tomographic model from Burdick et al., 2009 Most of the features are gone at depth greater than 300 km. A lot of observed waveform complexities are produced by relatively shallow mantle structures.
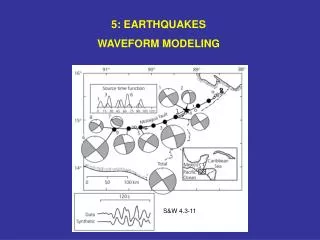
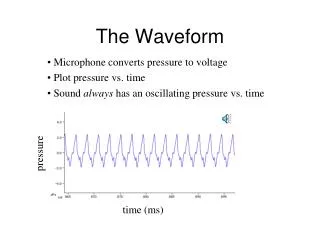
Waveform complexity along Rio Grande Rift zone [Song and Helmberger, 2007]
Azimuthal dependence of multi-pathing Strong multi-pathing, large ∆LR No multi-pathing, small ∆LR SE NW The preferred strong multi-pathing for the event from the south suggests that the anomalies in the upper mantle dip to the south [Sun, 2009].
Waveform complexity along Rio Grande Rift zone To fit this group of waveform data, enhancing the existing tomographic model (fast region inflated by a factor of 3 with slow region by 2) is required [Song and Helmberger, 2007]. If the S velocity anomaly is only half as suggested by S-wave tomography, we would expect a substantial underestimate of its temperature anomaly. Using waveform modeling in constraining the velocity structure (P and S) is crusical to understand the origin of these anomalies.
MPD on Southwestern US Instead of a 2D transect of La Ristra array, 3D structures are expected near Rio Grande rift and Colorado Plaetau [Sun and Helmberger, 2010].
In-plane vs. out-plane multi-pathing • Both multi-pathing are related to the sharp edges either in-plane or out-plane. • In-plane multi-pathing: records show more order along distance. • Out-plane multi-pathing: records show more order along azimuth. • Most data show the combination.
Summary • Juan de Fuca Slab modeled with a 60km layer with P and S velocities of 8.2 and 4.5km/s with penetration to 250km into a background tomography image by Schmandt and Humphreys(2010) where the reference model has been changed to mT7 containing a LVZ . • A lower Slab beneath Northern Nevada is required in the Transition Zone with enlarged P and S velocities by 3 and 7% which appears compatible with Van der Lee and Nolet (1997) and receiver functions by Cao and Levander(2010)
Summary • MPD is a useful tool and complementary to the tomographic model for mapping out the sharp features. • The dominant sharp structures beneath western US dip to the southeast direction. • Amplitudes from the waveform data are good indications of sharp features.
2D modeling of the data -2.5% 3% 6%
Outline • Tomographic models and waveform complexity • A new tool, Multi-pathing detector (MPD), to detect the sharp features • Examples of Western US upper-mantle structure