Download
1 / 18
180 likes | 247 Views
Table of Contents. Topic Page #. . 5.5A Parallel Lines 65. 5.5B Perpendicular Lines 66. 5.6 Fit a Line To Data 67. 5.7 Predict With Linear Models 68. 6.1 Inequalities w/ Addition 69. Less Than. Empty Circle.

E N D
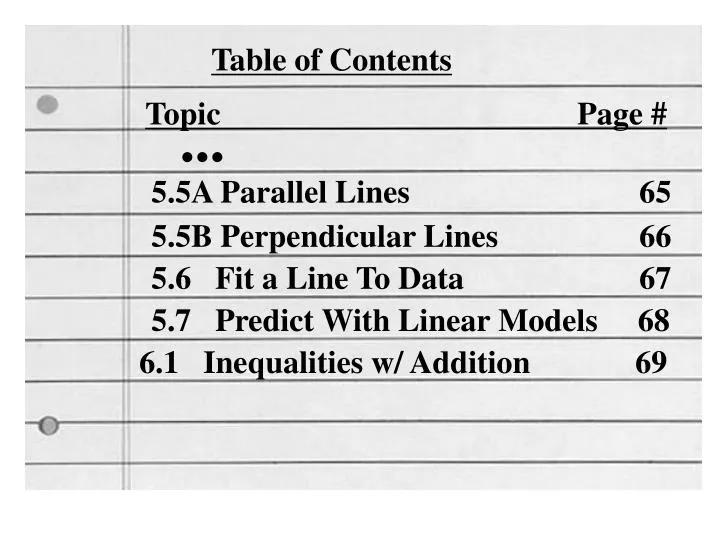
Table of Contents Topic Page # ... 5.5A Parallel Lines 65 5.5B Perpendicular Lines 66 5.6 Fit a Line To Data 67 5.7 Predict With Linear Models 68 6.1 Inequalities w/ Addition 69
Less Than • Empty Circle • Less Than or equal to • At most • No More Than • Full Circle
Greater Than • Empty Circle • Greater Than or equal to • At Least • No Less Than • Full Circle
Example 1: Write and graph an inequality. The highest temperature recorded in El Cajon was 113 degrees. -113 0 113
Example 1: Write and graph an inequality. You must be at least 13 years old to watch PG-13 movies. -13 0 13
Example 3: Solve AND graph an inequality using addition +9 +9 -12 0 12
Example 3: Solve AND graph an inequality using addition +5 +5 -8.5 0 8.5
Example 3: Solve AND graph an inequality using addition +9.2 +9.2 -4.2 0 4.2
Example 3: Solve AND graph an inequality using addition +1/2 +1/2 -½ 0 ½
Example 4: Solve AND graph an inequality using subtraction -7 -7 -2 0 2
Example 4: Solve AND graph an inequality using subtraction -5.5 -5.5 -0.5 0 0.5
Example 4: Solve AND graph an inequality using subtraction -14.9 -14.9 -17.6 0 17.6
Example 4: Solve AND graph an inequality using subtraction -23/6 0 23/6