Download
1 / 12
120 likes | 249 Views
Texture and Color Distribution-based Classification for Live Coral Detection. Joshua V. Stough, Lisa Greer, Matt Benson July 9, 2012. The Gist. Problem : Estimate live A. cervicornis cover Preliminary solution : linear SVM on quantile functions Train: Test:. Supervised Learning

E N D
Texture and Color Distribution-basedClassification for Live Coral Detection • Joshua V. Stough, Lisa Greer, Matt Benson • July 9, 2012
The Gist Problem: Estimate live A. cervicornis cover Preliminary solution: linear SVM on quantile functions Train: Test:
Supervised Learning Feature types: texture, color SIFT, GIST, GLCM – [van de Sande et al., TPAMI 2010] Discriminating learner Support Vector Machines – [Cortes, Vapnik, ML 1995] Random Forests – [Criminisi 2011] Clustering, Fisher, Gaussian Mixtures, Neural Net, ... Coral benthic studies NCC/LBP with NN – [Marcos et al., Optics 2005] Filter bank response with BoW/clustering –[Purser et al., MEPS 2009], [Beijbom et al., CVPR 2012] SVM on raw color –[Mehta et al., VISAPP 2007] Prior Work
Features: Color Quantile Functions (QFs) Inverse cumulative distribution function Mean shift, variance scaling are linear Computed for each color channel at local patches [Levina, UC-Berkeley 2002] [Broadhurst et al., ISBI 2006]
Experimental Setup 62 quadrat images Leave-one-out Each image/seg implies SVM classifier. Use closest in average QF SVM
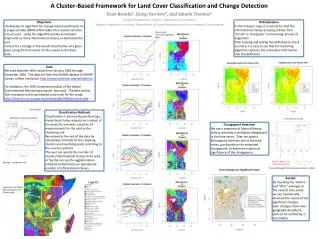
Validation Average Precision (AP) – area under the Precision/Recall curve Biased (not infinitely many negatives) Dice Similarity Coefficient (DSC) – intersection with manual, divided by average. Example PR curve DSC vs. PR
Results AP: .721 QFs (vs .714 raw) Figure: better by more, more often DSC: 63.8% overall
Future: Training Image Choice Average QF distance is poor predictor Image choice matters less than anticipated Normal: closest image provides good training Unlucky: closest image provides poor training Distribution of DSC over choice of training image, for all images
Point Counting is biased: Number (of points) Scale of decision Benthic density [Pante et al., 2012] Experiment: Manual segmentations as truth Simulate abundance estimation under various point counting parameters Point Counting Examplepositive, negative, 5cm scale
Miscellanea Better color normalization within/across images Different color spaces Boosting, different learners Explore feature spaces, inform the above Generalizability – separate training/val/test sets Erratum: white balance Thanks Acquisition/segmentation, coauthors, William Sullivan RE Lee and Lenfest institutional funds
More to do -current, future directions: graph cuts, better color alignment across regions or images, or a more local match. human interactive final product to save time. -point counting experiment, computer results showing bias (ref Pante article). More forthcoming. -erratum: white balance mention in paper. -different color spaces experiment. This is closely tied to the color or contrast normalization across an image as well. Often the corners have different lighting conditions (off-angle diffuse), making them darker (especially the images are already quadrat-normalized, then they were already taken off-angle). Should look into color rep's that potentially account for that, or even some model of matte surfaces along with camera angle info discernable from the quadrat selection to normalize color. Maybe that's what NCC (normalized chromaticity coords) accomplishes. Or accounting for shadow. -precision/recall curves, oooh with points on the curve corresponding to segmentations on those contour images, like the last figure. I would be cool to see it grow, hopefully in the right directions. -test generalizability of method with separate training and test set, maybe, rather than leave one out. Adaboost with random forest learner