Download

1 / 13
130 likes | 141 Views
AI: Neural Networks lecture 3 Tony Allen School of Computing & Informatics Nottingham Trent University. Perceptron-based network applications.

E N D
AI: Neural Networks lecture 3Tony AllenSchool of Computing & InformaticsNottingham Trent University
Perceptron-based network applications • Perceptron-based neural network classifiers are used in a wide range of domains from engineering to medical diagnosis. Two example applications are described here: • “Handwritten Digit Recognition by Neural Networks with Single-Layer Training”; S. Knerr, L. Personnaz & G. Dreyus; IEEE Transactions on Neural Networks, vol. 3, 962 (1992). • “Pattern recognition of the electroencephalogram by artificial neural networks”; Gabor Jando, Ralph M. Siegal, Zolt Horvath & Gyorgy Buzsaki; Electroencephalography and clinical Neurophysiology, 86 (1993) 100 –109.
Data Sets Examples of 8700 isolated digits from European data base of 13 writers Examples of 9000 digits from zip codes from U.S. Postal Service OAT Handwritten Zip code data base
Data Representation Low level representation: Isolated binary digits normalised in size to 16 x 16 4-bit grey scale pixel images = 256 bit input High level representation: Image scanned by 4 pairs of 4 Kirsch masks (3 x3) coding for horizontal, vertical or diagonal edges. This produces 4 x 8 x 8 feature maps = 256 bit input
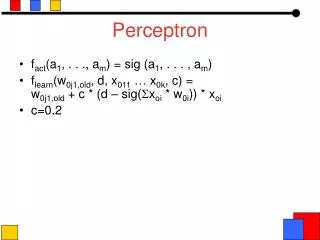
Neuron Architecture Sigmoidal function used during training – Step function during recall. • Each neuron is independently trained to separate two classes. • if v(i/j)<-q , then s(i/j)j=1 and s(i/j)i=0 ; • if v(i/j)>q, then s(i/j)j=0 and s(i/j)i=1 ; • otherwise s(i/j)j=s(i/j)i=0, indicating an ambiguous input pattern.
Training algorithm Generalised Delta rule used to train neurons. Learning rate fixed throughout training. Stopping condition = MSE minimized No overspecialisation of the classifier to the training set.
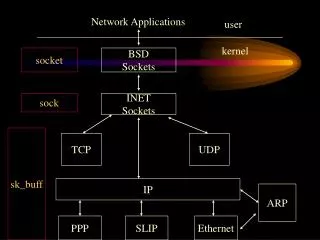
Overall Network Architecture • The final decision of the network is as follows: • if s(i/j)i=1 for all j, the output of the AND gate "i" is one, and the input pattern is assigned to class i; • if all AND gates have zero outputs, the input pattern is rejected.
Results High level feature representation gives better performance than low level pixel representation. Single layer network results better than multiple layer network results
Pattern recognition of electroencephalogram using MLP Neurocortical Spike and wave EEG patterns were recorded from 137 rats with genetically inherited petit mal epilepsy. Low level input representation: Sliding window of 40-640 ms worth of raw EEG data (4 –64 data points). High level representation:Sliding window of 40-640 ms worth of Fast Fourier Transform (FFT) of raw EEG data. Both real and imaginary parts of FFT used as input.
Network Training Training set: 1007 manually determined High Voltage Spike (HVS) episodes and ~2000 non-HVS episodes from 16 rats. Figs A – D show FFT network response from initial random weight output to trained weight output
Optimal Network Architecture Optimal number of Input & Hidden units for both input representations determined experimentally. FFT input network consistently outperforms raw EEG input network. Optimal FFT network architecture: Input = 16, Hidden = 19, Output = 1, Learning rate = 0.0001.
Results Traces 1- 4 show falsely recognised HVS episodes. Traces 5-8 show missed HVS episodes. Traces 9 & 10 show correctly recognised HVS episodes.
Use of Threshold Network analogue output thresholded. Choice of threshold level determines False Accept (FAR) and False Reject (FRR) rates. High threshold reduces FAR but increases FRR whilst low threshold value increases FAR and minimises FRR.