Download
1 / 1
10 likes | 108 Views
POTENTIAL WATER MIGRATION OF ORGANIC COMPOUNDS FROM POLYETHYLENE (PE) PIPES. ANALYSIS BY CLSA AND GC/MS. M. Om, M. Cortina, J . Caixach* and J . Rivera Laboratori d’Espectrometria de Masses, Dept. d’Ecotecnologies, IIQAB-CSIC, Jordi Girona 18-26, 08034 Barcelona. C. de Ciurana, X. Ballell

E N D
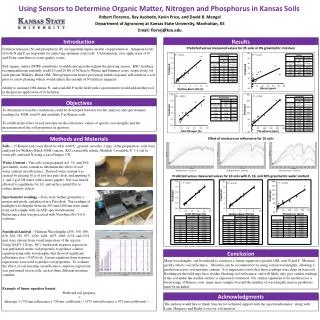
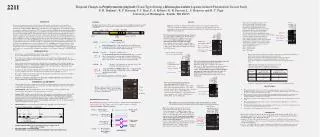
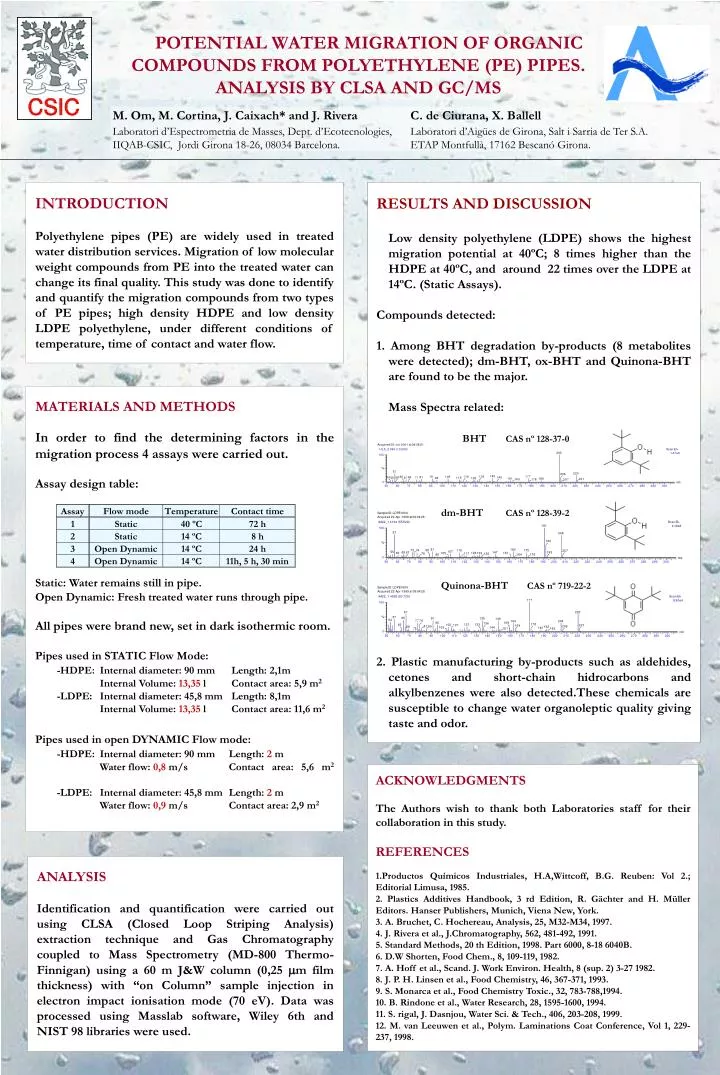
POTENTIAL WATER MIGRATION OF ORGANIC COMPOUNDS FROM POLYETHYLENE (PE) PIPES. ANALYSIS BY CLSA AND GC/MS M. Om, M. Cortina, J. Caixach* and J. Rivera Laboratori d’Espectrometria de Masses, Dept. d’Ecotecnologies, IIQAB-CSIC, Jordi Girona 18-26, 08034 Barcelona. C. de Ciurana, X. Ballell Laboratori d’Aigües de Girona, Salt i Sarria de Ter S.A. ETAP Montfullà, 17162 Bescanó Girona. INTRODUCTION Polyethylene pipes (PE) are widely used in treated water distribution services. Migration of low molecular weight compounds from PE into the treated water can change its final quality. This study was done to identify and quantify the migration compounds from two types of PE pipes; high density HDPE and low density LDPE polyethylene, under different conditions of temperature, time of contact and water flow. RESULTS AND DISCUSSION Low density polyethylene (LDPE) shows the highest migration potential at 40ºC; 8 times higher than the HDPE at 40ºC, and around 22 times over the LDPE at 14ºC. (Static Assays). Compounds detected: 1. Among BHT degradation by-products (8 metabolites were detected); dm-BHT, ox-BHT and Quinona-BHT are found to be the major. Mass Spectra related: BHT CAS nº 128-37-0 dm-BHT CAS nº 128-39-2 Quinona-BHT CAS nº 719-22-2 2. Plastic manufacturing by-products such as aldehides, cetones and short-chain hidrocarbons and alkylbenzenes were also detected.These chemicals are susceptible to change water organoleptic quality giving taste and odor. MATERIALS AND METHODS In order to find the determining factors in the migration process 4 assays were carried out. Assay design table: Static: Water remains still in pipe. Open Dynamic: Fresh treated water runs through pipe. All pipes were brand new, set in dark isothermic room. Pipes used in STATIC Flow Mode: -HDPE: Internal diameter: 90 mm Length: 2,1m Internal Volume: 13,35l Contact area: 5,9 m2 -LDPE: Internal diameter: 45,8 mm Length: 8,1m Internal Volume: 13,35 l Contact area: 11,6 m2 Pipes used in open DYNAMIC Flow mode: -HDPE: Internal diameter: 90 mm Length: 2 m Water flow: 0,8 m/s Contact area: 5,6 m2 -LDPE: Internal diameter: 45,8 mm Length: 2 m Water flow: 0,9 m/s Contact area: 2,9 m2 ACKNOWLEDGMENTS The Authors wish to thank both Laboratories staff for their collaboration in this study. REFERENCES 1.Productos Químicos Industriales, H.A,Wittcoff, B.G. Reuben: Vol 2.; Editorial Limusa, 1985. 2. Plastics Additives Handbook, 3 rd Edition, R. Gächter and H. Müller Editors. Hanser Publishers, Munich, Viena New, York. 3. A. Bruchet, C. Hochereau, Analysis, 25, M32-M34, 1997. 4. J. Rivera et al., J.Chromatography, 562, 481-492, 1991. 5. Standard Methods, 20 th Edition, 1998. Part 6000, 8-18 6040B. 6. D.W Shorten, Food Chem., 8, 109-119, 1982. 7. A. Hoff et al., Scand. J. Work Environ. Health, 8 (sup. 2) 3-27 1982. 8. J. P. H. Linsen et al., Food Chemistry, 46, 367-371, 1993. 9. S. Monarca et al., Food Chemistry Toxic., 32, 783-788,1994. 10. B. Rindone et al., Water Research, 28, 1595-1600, 1994. 11. S. rigal, J. Dasnjou, Water Sci. & Tech., 406, 203-208, 1999. 12. M. van Leeuwen et al., Polym. Laminations Coat Conference, Vol 1, 229-237, 1998. ANALYSIS Identification and quantification were carried out using CLSA (Closed Loop Striping Analysis) extraction technique and Gas Chromatography coupled to Mass Spectrometry (MD-800 Thermo-Finnigan) using a 60 m J&W column (0,25 mm film thickness) with “on Column” sample injection in electron impact ionisation mode (70 eV). Data was processed using Masslab software, Wiley 6th and NIST 98 libraries were used.