1 / 0

MARACOOS: Delivering Benefits to Water Utilities and River Basin Communities

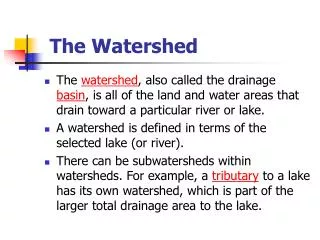
MARACOOS: Delivering Benefits to Water Utilities and River Basin Communities. Bob Tudor Deputy Director Delaware River Basin Commission. Delaware River Watershed Facts. Over 15 million people (about 5% of the U.S. population) rely on the waters of the basin

afi
Download Presentation

MARACOOS: Delivering Benefits to Water Utilities and River Basin Communities

An Image/Link below is provided (as is) to download presentation Download Policy: Content on the Website is provided to you AS IS for your information and personal use and may not be sold / licensed / shared on other websites without getting consent from its author. Content is provided to you AS IS for your information and personal use only. Download presentation by click this link. While downloading, if for some reason you are not able to download a presentation, the publisher may have deleted the file from their server. During download, if you can't get a presentation, the file might be deleted by the publisher.

E N D

Presentation Transcript


  1. MARACOOS: Delivering Benefits to Water Utilities and River Basin Communities

    Bob Tudor Deputy Director Delaware River Basin Commission
  2. Delaware River Watershed Facts Over 15 million people (about 5% of the U.S. population) rely on the waters of the basin Drains 13,539 mi² , or 0.4 of 1% of the continental U.S. land area Longest undammed river east of the Mississippi Daily water withdrawal in the DRB = 8.7 billion gallons/day
  3. DRBC’s Charge Interstate/Federal Compact Commission Manage water resources w/out regard for political boundaries Regulate water quantity (equitably allocate, maintain streamflow) and water quality Coordinate between federal, state & local governments and private entities w/ role in managing water resources Coordinate with Water Utilities regarding reservoir operations, flow management, long term water supply planning, and early warning systems Member of MARACOOS (Interested in Linking Water User needs to IOOS capabilities)
  4. Mid-Atlantic Regional Association Coastal Ocean Observing System (MARACOOS)http://www.maracoos.org/ MyMARACOOS Ocean/Coastal Info Portal www.mymaracoos.org
  5. Conceptual Management Framework Monitoring/Observation Data Products Dynamic Management Tools Improved Management Outcomes (“Solutions”)
  6. Real World Case Studies New York City OST (Reservoir Operations) DRBC Long Term Water Supply Planning (Sustainable Water Use/Salt Line Dynamics) Spill Event Coordination (Vinyl Chloride - 2012)
  7. New York City Water Supply 3 systems – Delaware, Catskill, and Croton 19 reservoirs & 3 controlled lakes 2,000 square mile watershed in parts of 8 upstate counties Serves 9 million people (1/2 of population of New York State) Delivers ~ 1.1 billion gallons per day 45% of demand met by Delaware basin reservoirs Unfiltered supply (Cat/Del)
  8. What is OST? Computer Decision Support System Ingests real-time data Links water quality and water quantity models Assimilates streamflowforecasts
  9. What Does OST Do? OST quantifies the performance of alternative operating decisions Provides robust quantitative assessment of: Better defines capacity of system to meet objectives: Water quantity (reliability) Water quality Enhanced reservoir flood mitigation Environmental / release objectives Expected inflows Diversion needs Release requirements Spill rates Storage levels Drought risk
  10. OST-FFMP Framework Today’s Conditions Reservoir Levels Infrastructure Status Water Quality Demand Projections Operating Rules System Reliability Reservoir Balancing Drinking Water Quality Releases Ensemble Inflow Forecasts OST INPUT Refill Probability Water Quality Storage Levels OST DECISION- MAKING Low Water Availability High Water Availability Probability of Excess Water At Specified Risk Level DELAWARERELEASE DECISIONS Base Sustainable Schedule A Schedule B Schedule C Schedule D Schedule E Schedule F
  11. Why Probabilistic Forecasts? Effectiveness of today’s operating decisions depends on future inflows Decisions can thus be improved with inflow forecasts Probabilistic forecasts give range and likelihood of future inflows Help managers quantify risk associated with operations decisions
  12. OST Usage Refill Probability & Drought Risk Analysis Outage Planning & Emergency Management Operating Rule Development & Water Supply Planning Climate Change Planning & Demand Management Studies New Infrastructure
  13. Salt Line (250 mg/l, 7-day avg.) Real World Case Studies Water Supply Intakes RM 110 1960’s Maximum Normal RM 77 Data for determination provided by the U.S. Geological Survey and Kimberly Clark Corp.
  14. Water Intakes at Risk from Drought and Sea Level Rise:Location of the Salt Line at High Tide During Drought Power Exelon Delaware Generating Station Exelon Richmond Generating Station Philadelphia Gas Works Richmond Industrial Koch Material Co. NGC Industries Rohm and Haas Philadelphia MacAndrew and Forbes Co. Pennwalt Corp. Sunoco Public Supply Torresdale Water Intake (provides almost 60% of Philadelphia’s water supply) New Jersey American Water Co. Tri-County Water Treatment Plant
  15. Will We Have Enough Water? More water needed to control salt line Retaining water for droughts during intense storms; Impacts on flood mitigation Green and grey infrastructure solutions DRBC Strategy for Sustainable Water Resources - 2060 Analysis of drivers and solutions USGS, USACE, NOAA (IWRSS Pilot Study)
  16. DRBC Drought Operating Plans New York City-Delaware Basin Reservoirs Drive BasinwideOperating Plan Cannonsville Pepacton Neversink Two U.S. Army Corps of Engineers Reservoirs Drive Lower Basin Operating Plan Beltzville Blue Marsh Merrill Creek Reservoir Merrill Creek Reservoir Montague Trenton
  17. Sustainable Water Resources - 2060 Population – Change and Location Energy Generation – Water Footprint Ecological Flows Natural Gas Development? Climate Change Sea level rise, intense storms, droughts
  18. Spill Event Coordination:Vinyl Chloride Spill Event A train derailed in Mantua Creek in Paulsboro, N.J. (near Philadelphia), releasing 23,000 gallons of Vinyl Chloride on November 30, 2012 Prompt modeling was performed by DRBC to provide time of impact on water utilities nearby Coordinated with modeling group of NOAA/NOS Emergency Response Division in Seattle, WA – refining the model and modeling results were used to guide the recovery activities Source: http://response.restoration.noaa.gov/about/media/train-derails-paulsboro-nj-releasing-23000-gallons-toxic-vinyl-chloride-gas.html
  19. Schematic Depiction of the Automated and Manual Processes for Modeling in Responseto a Release Event
  20. Placeholder for the Animated Simulation Result Plot
  21. Summary of Observation, Modeling, and Information Delivery Needs Reservoir Operations: Probabilistic Inflow Forecasts; Proactive Releases in Advance of Large Storm Events Basin Scale Planning: Extreme Weather Events (Drought and Flood Risk Management) Spill Event Coordination: USCG Contingency Plan Implementation
  22. Discussion Photo Courtesy of NYC DEP
More Related