Download
1 / 22
220 likes | 411 Views
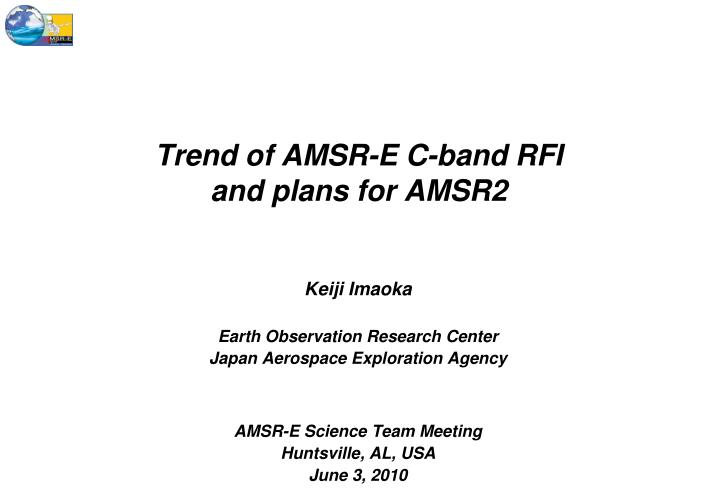
Trend of AMSR-E C-band RFI and plans for AMSR2. Keiji Imaoka Earth Observation Research Center Japan Aerospace Exploration Agency AMSR-E Science Team Meeting Huntsville, AL, USA June 3, 2010. Introduction.

E N D
Trend of AMSR-E C-band RFIand plans for AMSR2 Keiji Imaoka Earth Observation Research Center Japan Aerospace Exploration Agency AMSR-E Science Team Meeting Huntsville, AL, USA June 3, 2010
Introduction • Radio-frequency Interference (RFI) problem has been evident in AMSR-E brightness temperatures at 6.925GHz, particularly over land areas. • Two motivations to revisit this issue: • Seeking the possibility of masking RFI areas, as a part of the AMSR-E Level-1 product updates. • Preparation for the AMSR2 RFI flagging algorithm, in combination with the utilization of 7.3GHz. • Simple threshold method (Njoku et al. 2005) was applied to 6-years AMSR-E data to check temporal and regional trends of C-band RFI.
Trend of Radiometer Sensitivity End of Nominal Ops. GCOM-W1 Launch (into A-Train) 89GHz A anomaly Swap ADE A to B Torque increase began Radiometer sensitivity [K]
Trend of HTS Temperatures HTU#1 South pole HTU#2 Descent equator crossing HTU#3 Position in orbit HTU#4 North pole HTU#5 Ascent equator crossing [K] 2002/06 2009/03 Years HTU#6 HTU#7 [K] HTU#8 Physical temperature anomaly of HTS PRTs during June 2002 and June 2008. Red, green, and blue indicate max, average, and minimum, respectively.
Tb Monitoring over Rain Forests Bitam Maripasoula Putusibau
Possible RFI in AMSR-E C-band AMSR-E max-hold Tb map, 6G-H ascending, 2003
C-band RFI Identification • Papers published by several teams using AMSR-E and Windsat data (e.g. Njoku 2005). • AMSR and AMSR-E data analysis in terms of RFI by our team (Arai, IGARSS05). • Possible RFI detection methods include: • Spectral or polarization index (or combination) • Time series stability • Directional property • Full polarimetric capability • Currently no perfect methods for detecting C-band RFI over land: need some mitigation techniques in future system.
Data Processing • Simple threshold method like by Njoku et al. 2005. • Used Level-1R prototype to compensate spatial resolution mismatch among different frequency channels. • Created 0.25 degrees global grids for 2002-2008 data. • Derived monthly mean and standard deviation of TB differences between neighboring frequency channels (e.g. TB06V-TB10V, TB10V-TB18V). • Roughly corrected seasonal variations by subtracting monthly medians in large areas (e.g. United States). • Used objective thresholds of 10K (mean) and 5K (standard deviation) to identify possible RFI areas.
Directional Property 2002/09A • AMSR-E observes a certain area from various direction during the 16-day recurrence period. • Clear directional property (periodical patterns in time series) can be seen, when the number of emitters within the footprint might be small. • Monthly (approx. twice the recurrence period) standard deviation is a reasonable indicator of directional property. • Natural variabilities such as snow/ice melting are also mistakenly detected. + +
Directional Property Azimuthal properties of man-made radio emissions over two areas in Japan. Upper two panels show AMSR-E brightness temperatures (radial distance) and the observing azimuth angles for the areas near Kofu City (left) and Kitami City (right) in year 2003. Lower two panels show locations of two areas (left) and examle of yearly averaged brightness temperature difference between 6.9GHz and 10.65GHz v-pol channel.
Scatter Plot of Differece/Standard Dev. 6V-10V: US 6V-10V: Europe 10V-18V: Europe 10V-18V: US
Identified Possible RFI Areas 10.65GHz 6.925GHz Europe Europe US US S-E Asia S-E Asia Japan Japan
Identified Possible RFI Areas (6.9GHz) 2002/09A 2002/09A 2007/09A 2007/09A
Identified Possible RFI Areas (6.9GHz) 2002/09A 2002/09A 2007/09A 2007/09A
Day-Night Difference (10.65GHz) Nighttime Daytime 2007/09D 2007/09A 2007/09D 2007/09A
Window PC Spectrum Analyzer Log-periodic antenna LNA High-pass Filter GPIB GPS Video Aircraft Measurement (2006) • Purpose Since detailed information of man-made emission is not available, actual measurements are informative (even though they are limited in terms of place and time). • Aircraft Beechcraft Queen-Air (BE65) owned by JAXA • Measurement setup • Simple setup without calibration function to obtain rough information of RFI spectrum and distribution. • Log-periodic antenna (Gain=7dBi, H-pol) • RF cable (Loss=2.5dB) • High-pass filter • LNA (Gain=45dB, NF=2.2dB) • Spectrum analyzer (HP8593E) • Personal computer (data acquisition) • Ancillary information (GPS, Video) • Experiment parameters • Date: 2005/11/28, 2006/01/16,17,25 • Flight area: See next slide • Altitude: 2.5~3.5km • Frequency: 6-8GHz (5MHz resolution) • Sampling interval: 10 sec (max hold) • Flight speed: ~ 300km/h • Flight hours: ~ 10 hours • Number of spectrum: 3285 total Measurement setup of aircraft observation Experiment platform (Beech Queen-Air) and measurement setup.
◆Tokyo ◆Nagoya ◆Kyoto ◆Osaka ◆Hiroshima ◆Kagoshima Aircraft Measurement (2006) GPS tracks of experimental flights over Japan. RFI signals within AMSR-E bandwidth were indicated by red color. Yellow arrows show the measurement direction. AMSR-E maximum TB during from November 13 to 28 (16 days, recurrent period of Aqua) over Japan for 6.9GHz horizontal polarization channel. Figures may indicate possible strong RFI-contaminated areas. [K]
Aircraft Measurement (2006) WindSat AMSR-E [dB] [K] → Time (position) → AMSR2 AMSR-E WindSat 6GHz ← Frequency → 8GHz Maximum TB during 16 days over Japan for orthogonal polarization channels (V and H) and orbit directions (ascending and descending). Note that periods of data are different for AMSR-E (November 13-28, 2005) and WindSat (October 5-20, 2003). Examples of RFI spectra obtained on November 28 (Kanto Koshinetsu area). Bandwidths of AMSR-E and WindSat are indicated on the figure. It seems that less RFI signals in WindSat bandwidth is consistent with satellite data.
Preliminary Check of Sub-banding (2006) • Due to the resource limitation, 2 sub-bands will be adopted for AMSR2. • Current 6.925GHz + Experimental 7.3GHz channel • Probably no improvement of RFI condition, but some RFI flagging can be expected. • Safe to keep the current success of 6.925GHz for measuring SST. Preliminary check of sub-band effectiveness for two center frequency cases (6.9 and 7.3 GHz) derived from aircraft measurement on November 28, 2005. Practical configurations were indicated by light-blue cells. Percentages of RFI-contaminated spectra were calculated using original and spatially averaged (50-points moving average) spectra to simulate large satellite footprint. Note that this is just an ideal assessment. Actual rejection and identification of RFI in satellite data need practical algorithm. Possible selectable conditions in case of 2 sub-bands. RFI clear RFI contaminated TB [K] TB [K] TB [K] TB [K] SB1 SB2 SB3 SB4 SB1 SB2 SB3 SB4 SB1 SB2 SB3 SB4 SB1 SB2 SB3 SB4
Summary and Plans for AMSR2 • AMSR-E C-band RFI • RFI areas and positions change with time, probably with changes of human utilization of radio spectrum. Clear changes may be visible with radio regulation revisions and replacement of infrastructure. • Static (fixed) RFI mask does not work for C-band RFI over land, but the current AMSR-E channel set is not enough for doing dynamic masking. Post-processing of improved mask is a possible solution. • Plans for AMSR2 • 7.3GHz chanels will be added to increase information. • Simple RFI flag will be tested using 6.9 and 7.3 GHz, assuming small differences in instruments and real spectrum. Multi-frequency methods may be needed to complement the ***