Download
1 / 23
230 likes | 460 Views
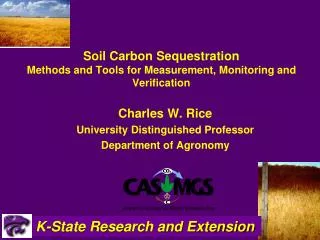
Methods and Tools for Measurement, Monitoring and Verification for Soil Carbon Sequestration Markets. Charles W. Rice Department of Agronomy. K-State Research and Extension. Measurement, Monitoring and Verification. Verifiable and transparent for reporting changes in soil carbon stocks

E N D
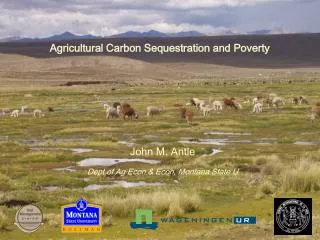
Methods and Tools for Measurement, Monitoring and Verification for Soil Carbon Sequestration Markets Charles W. Rice Department of Agronomy K-State Research and Extension
Measurement, Monitoring and Verification • Verifiable and transparent for reporting changes in soil carbon stocks • (i.e., withstand reasonable scrutiny by an independent third party as to completeness, consistency, and correctness) • Cost efficient if soil C will be competitive with other C offsets • Based on best science possible • Meet requirements that are specified by international conventions • Designed to work with data currently available but compatible with different types of data or new methods of data collection
Measurement, Monitoring and Verification • Provide accounts and associated uncertainties for soil C measurements • Flexible to accommodate new scientific developments (e.g., instrumentation, process or empirical models) • Reporting structures that are flexible to meet the needs of different users
Measurement, Monitoring and Verification • Detecting soil C changes • Difficult on short time scales • Amount of change small compared to total C • Methods for detecting and projecting soil C changes (Post et al. 2001) • Direct methods • Field measurements • Indirect methods • Accounting • Stratified accounting • Remote sensing • Models Post et al. (2001)
Estimating Changes in Soil Organic Carbon • Issues • Choice of baseline • Comparison to current practice • Start and end time points • Measure C sequestration or avoided C loss • Uncertainty and cost in estimating soil C • Measure and report mean and variation • Seasonality • Soil sampling • Depths • Roots • Carbonates • Rocks
Geo-reference microsites • Microsites reduces spatial variability • Simple and inexpensive • Used to improve models • Used to adopt new technology • Soil C changes detected in 3 yr • 0.71 Mg C ha-1 – semiarid • 1.25 Mg C ha-1 – subhumid Ellert et al. (2001)
Methods to Extrapolate Measurements and Model Predictions from Sites to Regional Scales • Models • CENTURY • EPIC • RothC • Other models are also being developed • Spatial aggregation of soil carbon distribution • Remote sensing and climatic data • Indices: • Productivity • Practice monitoring
Resources Available for National-level Assessments • NRCS/STATSGO soil data • Daily Climate data from NOAA • 1997 NRI area weights • NRCS/ERS Cropping Practices Survey • NRCS/National Soils Laboratory Pedon Database
Remote Sensing and Carbon Sequestration • Remote sensing useful for assessing • Vegetation • Type • Cover • Productivity • Water, soil temperature • Tillage intensity? • Remote sensing cannot be used to measure soil C directly unless soil is bare Crop identification for spatial modeling. Courtesy: P Doraiswamy, USDA-ARS, Beltsville, MD
Several satellite and airborne sensors can estimate LAI, NPP, crop yields, and litter cover • Traditional sources of land cover data: • AVHRR and Landsat • Increased resolution being obtained with MODIS • Good temporal resolution • MODIS and AVHRR • Excellent spatial detail provided by • Landsat and SPOT • IKONOS and Quickbird offer excellent spatial and temporal resolution • Two airborne sensors • AVIRIS • LIDAR
Biomass C Passive C Slow C Leached C CSiTE and CASMGS terrestrial ecosystem models Processes and drivers • Century • Century • DayCent • C-STORE • EPIC • EPIC • APEX Carbon and nitrogen flows Metabolic Litter Residue C Structural Litter
In Situ Measurements of Soil Carbon with Advanced Technologies R.C. Izaurralde, M.H. Ebinger, J.B. Reeves, C.W. Rice, L. Wielopolski, B.A. Francis, R.D. Harris, S. Mitra, A.M. Thomson, J.D. Etchevers, K.D. Sayre, A. Rappaport, and B. Govaerts
Laser Induced Breakdown Spectroscopy: LIBS • Based on atomic emission spectroscopy • Portable • A laser pulse is focused on a soil sample, creating high temperatures and electric fields that break all chemical bonds and generating a white-hot plasma • The spectrum generated contains atomic emission peaks at wavelengths characteristic of the sample’s constituent elements Cremers et al. (2001) J. Environ. Qual. 30:2202-2206
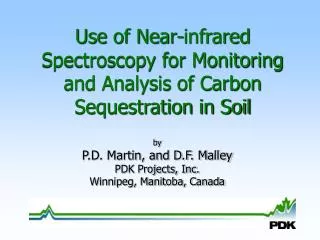
Emerging technologies for measuring soil C: MIR / NIR • Mid Infrared / Near Infrared Spectroscopy (MIR / NIR) • Non-destructive method measurement of C in soils based on the reflectance spectra of illuminated soil • Spectral regions • NIR: 400–2500 nm • MIR: 2500–25000 nm • Excellent potential for assessment of spatial distribution of belowground C MIR and NIR spectra of a calcareous soil before and after treatment with acid for removal of carbonates. Source: McCarty et al. (2002)
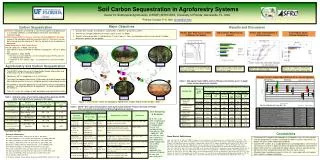
Field Test: CIMMYT, Mexico; April 2007 • Conducted at CIMMYT on a 17-year old crop rotation, tillage, residue study • Treatments sampled: • Maize (m) and wheat (w) grown in monoculture (M) or in rotation (R) • Grown with conventional (CT) or no tillage (ZT), and with (+) or without (-) removal of crop residues • Each treatment is replicated twice • A composite soil sample made of 12 subsamples per soil depth (0-5, 5-10, and 10-20 cm) was taken from each of the 22 x 7.5 m plots. General view of plots No Till w/o residues No Till with residues
Mean soil C density (kg C m-2) by treatment and summary statistics in the CIMMYT experiment • Although LIBS and MIRS followed the C density trends detected by DC method • Correlation between methods was low • LIBS vs. DC: R2 = 0.174 • MIRS vs. DC: R2 = 0.329
Further calibration of CIMMYT data • Partial Least Squares method was used to improve calibration curves • A calibration curve was developed using 31 samples run 3 times each (1 missing value) • Re-estimation of data points improved significantly (see graph on the right)
Further calibration of MIRS of CIMMYT data • Original estimation of data using MIRS was developed with the calibration curve based on Maryland samples and 8 samples from Mexico • Eleven samples from the set of 112 were added to the calibration curve • Prediction of the remainder 101 points improved significantly with the revised calibration curve that used the Maryland data points plus the 19 Mexican data points • With the MIRS method, the greatest difficulty in predicting the correct values seems to be associated with high C samples
Conclusions • By using principles of soil science • Minimize spatial variability • Reduce number of samples • Decrease costs • Increase efficiency • Increase sensitivity for detecting change • Allow adoption of new technology • Extrapolation • Modeling • Remote sensing
Chuck Rice Phone: 785-532-7217 Cell: 785-587-7215 cwrice@ksu.edu • Websites www.soilcarboncenter.k-state.edu/ K-State Research and Extension