Download
1 / 26
260 likes | 462 Views
MFA Methodology – All Materials. Domestic Environment. Foreign Hidden Flows. Air and Water. Water Vapor. Imports. Exports. Economic Processing. Domestic Extraction. Domestic Processed Output ( DPO ) (to Air, Land and Water). DMI. TDO. TMR. TMI. Stocks. TMO. Domestic

E N D
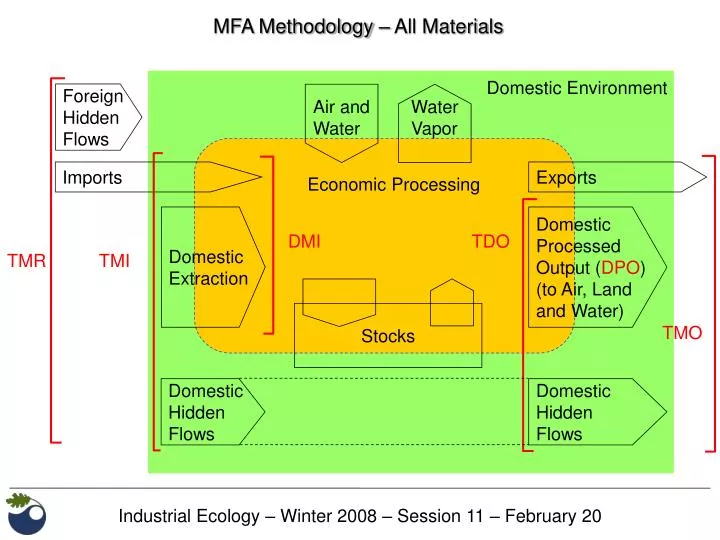
MFA Methodology – All Materials Domestic Environment Foreign Hidden Flows Air and Water Water Vapor Imports Exports Economic Processing Domestic Extraction Domestic Processed Output (DPO) (to Air, Land and Water) DMI TDO TMR TMI Stocks TMO Domestic Hidden Flows Domestic Hidden Flows
MFA Methodology – All Materials Input flows: DMI Foreign Hidden Flows Direct Material Input = Domestic Extraction + Imports Imports Domestic Extraction TMI DMI Total Material Input = Direct Material Input + Domestic Hidden Flows TMR TMI TMR Total Material Requirement = Total Material Input + Foreign Hidden Flows Domestic Hidden Flows
MFA Methodology – All Materials Output flows: Domestic Environment DPO Domestic Processed Output (DPO) = Direct Material Input + Net Additions to Stock – Exports Exports Domestic Processed Output (DPO) (to Air, Land and Water) TDO TDO Total Domestic Output (TDO) = Domestic Processed Output + Domestic Hidden Flows TMO TMO Total Material Output (TMO) = Total Domestic Output + Exports Domestic Hidden Flows
MFA Methodology – All Materials Domestic Environment Foreign Hidden Flows Air and Water Water Vapor Imports Exports Economic Processing Domestic Extraction Domestic Processed Output (DPO) (to Air, Land and Water) DMI TDO TMR TMI Stocks TMO Domestic Hidden Flows Domestic Hidden Flows
MFA Methodology – All Materials Input Flows (origin) Domestic extraction Fossil fuels (coal, oil, etc.) Minerals (ores, gravel, etc.) Biomass (timber, cereals, etc.) + Imports Fossil fuels, Minerals, Biomass Semi-finished goods Final Goods Direct material input (DMI) + Unused domestic extraction from mining/quarrying from biomass harvest soil excavation Total material input (TMI) + Unused foreign extraction from mining/quarrying from biomass harvest soil excavation Total material requirements (TMR) Output Flows (destination) Emissions and wastes Emissions to air Waste to land Emissions to water + Dissipative use of products (Fertilizer, manure, compost, seeds, paints, pesticides, etc.) Domestic processed output to nature (DPO) + Disposal of unused domestic extraction from mining quarrying from biomass harvest soil excavation Total domestic output to nature (TDO) + Exports Fossil fuels, Minerals, Biomass Semi-finished goods Final Goods Total material output (TMO)
MFA Methodology – All Materials Mass balance equation: Inflows – Outflows = Stock Change Net Additions to Stock (NAS) = Domestic extraction + Imports – Direct Processed Output – Exports Net Additions to Stock (NAS) Imports Exports Domestic Extraction Domestic Processed Output (DPO) (to Air, Land and Water) Stocks Net Additions to stock (NAS): Infrastructure and buildings Machinery & durable goods etc.
Material Flow Perspective of Pollution Prevention: • If pollution is caused by material flows, its prevention is also a material issue: • There are essentially three ways to reduce or prevent pollution: • Dematerialization (less material to achieve the same function) • Substitution (different substance or material) • Reuse & recycling (use material and value-added over and over)
Dematerialization examples • Advanced High Strength Steels (AHSS) in automotive applications (25% weight reduction) • Mass reduction of beverage containers • Continuous casting technology in metals production • Drip lines instead of sprinklers for irrigation • Carsharing business models • Spaceframe design concept • Miniaturization in the electronics industry (e.g. precious metal content in consumer electronics) Dematerialization typically has a natural economic driver and is also often done in conjunction with material substitution.
Dematerialization / Resource Productivity Material flow indicator Decoupling from economic growth GDP Material flow indicator Decoupling from population growth Capita Generic environmental indicator Environmental Kuznets Curve GDP per Capita Hypothesis: Dematerialization occurs naturally as nations get wealthier • Criticism: • Trans-materialization • Re-materialization • Earths carrying capacity is absolute not relative • 3 main ways for dematerialization: • Increase primary resource productivity • Decrease material intensity of consumption • Increase resource productivity through reuse and recycling
Material substitution examples • Steel versus aluminum versus plastics versus composites in automotive • Steel versus concrete versus timber in construction • Glass versus steel versus aluminum versus PET versus laminated cardboard in packaging • MTBE instead of lead as oxygenate in automotive fuels • Bio-based plastics versus petroleum-based plastics (e.g. polylactic acid) • Lead-based solder versus lead-free solder (e.g. tin silver copper antimony alloy, tin copper selenium alloy, etc.)
Material substitutionCase study 1 – Lead-free solder Background: Electronics industry consumes around 90 Kt pa of lead-based solder (60%Sn-40%Pb), 25-50% of which is process waste (recycling rate ?). Issue: Toxicity of lead (EU ROHS Directive 2002/95/EC bans lead in EEE) Substitute: Lead-free solder (e.g. the one announced by Sony in 1999: 93.4% tin, 2% silver, 4% bismuth, 0.5% copper and 0.1% germanium)
Material substitutionCase study 1 – Lead-free solder • Lead-free solder announced by Sony in1999: • 93.4% Sn, 2% Ag, 4% Bi, 0.5% Cu and 0.1% Ge • New issues: • Production capacity for increased use of alloying materials: If all solder was based on Sony’s alloy, world production would increase as follows Sn +12%, Ag +11%, Bi +89%, Ge +103% • Bismuth by-product of mining other metal, especially lead, copper and tin • Depletion of some of the alloying metals Alternative : Electrically conductive adhesives (polymer binder plus conductive filler)?
Material substitutionCase study 2 – Bio-based plastics Background: Production of plastics worldwide consumes around 270 MMT pa of fossil fuel, 120 MMT as feedstock and another 150 MMT as process energy. Issues:• Depletion of fossil fuels • Additives (plasticizers, stabilizers, flame retardants, blowing agents) • Lack of biodegradability (growing and persistent solid waste stream) Substitute: Bio-based polymers (e.g. PLA or PHA) Examples: • NatureWorks (Cargill Dow Polymers, USA) – packaging films, bottles, textile fibers based on polylactic acid from maize fermentation • GreenFill (GreenLight Products, UK) – loosefill packaging derived from wheat starch • Mater-Bi (Novamont, Italy) – films, tableware, nappies based on a copolymer of maize starch and polycaprolactone • (PotatoPak, UK) – supermarket display trays based on potato starch • (Rodenburg Polymers, NL) – packaging materials from potato starch • NatureFlex (Surface Specialities, UK) – cellulosic packaging films
Material substitutionCase study 2 – Bio-based plastics American Society for Testing and Materials (ASTM) definition: “Biodegradable plastic: a degradable plastic in which the degradation results from the action of naturally occurring microorganisms such as bacteria, fungi and algae”. The first compostable logo for cutlery went to Nat-Ur. The Biodegradable Products Institute’s (BPI) symbol demonstrates that the product meets the ASTM D6400 “Specifications for Compostable Plastics”.
Material substitutionCase study 2 – Bio-based plastics • European Standard for biodegradability is BS EN 13432 (2000): • Biodegradation: over 90% compared with cellulose in 180 days under conditions of controlled composting using respirometric methods (ISO14855) • Disintegration: over 90% in 30 months (ISO FDIS 16929) • Ecotoxicity: test results from aquatic and terrestrial organisms (Daphnia magna, worm test, germination test) as for reference compost • Absence of hazardous chemicals (included in the reference list)
Material substitutionCase study 2 – Bio-based plastics • In an LCA the cradle-to-gate GHG emissions of polyhydroxyalkanoate (PHA), a bio-polymer extracted from genetically modified corn, were compared to those of polyethylene (PE). • New issues: • The extraction process of PHA from corn stover is quite energy intensive. • If the extraction energy comes from fossil fuels, the cradle-to-gate GHG emissions of PHA are higher than those of PE. • Cradle-to-gate GHG emissions of PHA are lower than those of PE only if the stover is burned for energy generation, i.e. no fossil fuels are required for PHA extraction.
From supply chains to supply loops Traditional supply chains end with the sale and delivery of the final product Raw materials mining Primary materials production Component manufacture Final product assembly Product sale and delivery Lee & Billington, for example, define a supply chain as […] a network of facilities that procure raw materials, transform them into intermediary goods and then final products, and deliver the products to customers through a distribution system. Product demand & use End-of-life product disposal What happens to the product after sale and deliveryis of no concern for supply chain managers
Supply loops divert end-of-life products from landfill and reprocess these products, their components or their materials into secondary resources which replace primary resources in forward supply chains. Raw materials mining Primary materials production Component manufacture Final product assembly Product sale and delivery Product demand & use Materials re- processing Component re- processing Product re- processing Eol product collection & inspection End-of-life product disposal
A supply loop is constrained when it is not able, for technical or economic reasons, to reprocess all targeted arising end-of-life products into secondaryoutput that is marketable a above-cost prices. Raw materials mining Primary materials production Component manufacture Final product assembly Product sale and delivery Product demand & use Materials re- processing Component re- processing Product re- processing Eol product collection & inspection End-of-life product disposal • The reasons can be: • Limited collection of end-of-life products • Limited feasibility of reprocessing • Limited market demand for the reprocessed secondary resources
Supply Loops Reuse and recycling – Environmental benefits 1. 2. Use Disposal Production • Diversion of product or process waste from landfill or incineration by collecting them for economic value recovery via reprocessing. • Generation of secondary resources from product or process waste and displace primary resources, i.e. materials, components and products. The environmental benefits from displacement can be significantly higher than the benefits from avoided landfill / incineration.
Supply Loops - Material Recycling - Definitions Material Production Product manufacturing Use Disposal Material reprocessing eol recycling efficiency rate Eol collection rate Eol reprocessing yield recycling input rate recycling efficiency rate
Supply Loops – Materials Recycling – Infinite Cycles Materials use End-of-life product disposal Materialsproduction is the recycling efficiency rate for each cycle Question: How much recycled material do I get from m primary material? Total amount of material (assuming unlimited recyclability) is Summing this series gives of which is secondary (recycled) material. Overall recycling efficiency rate: Example: ρ = 0.66, m = 1kg M = 3kg 1kg primary 2kg secondary
Supply Loops – Basic Environmental Performance Use Euse End-of-life disposal Edisp Production Eprod Reprocessing Erepro Collection Ecoll • Life cycle impact (of a chosen environmental impact category): • Without recycling: • With recycling: • Change in life cycle impact • Recycling reduces life cycle impact if
Supply Loops Basic Environmental Performance – Examples
Due Date of Assignment 3: Wednesday, 27 February:Reading for Friday, 22 February:Geyer & Jackson (2004) Supply loops and their constraints: The industrial ecology of reuse and recycling, Cal Man Rev 46(2), 55-73Davis et al. (2007) Time-dependent MFA of iron and steel in the UK, Resources, Conservation & Recycling 51(2007), 118-140(is posted on course website)