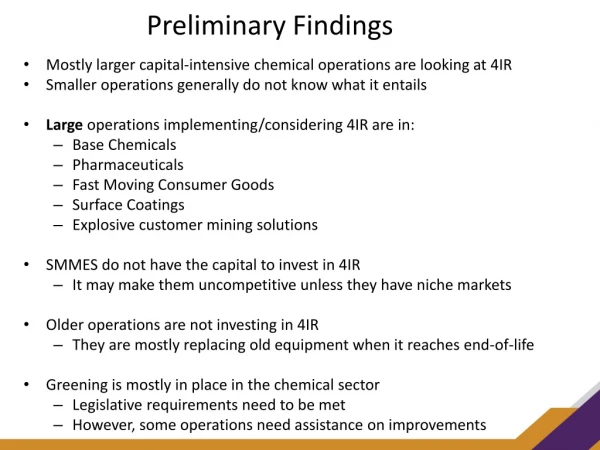
Download
1 / 24
240 likes | 350 Views
Migration of Chinese scientists and their productivity 1998-2006 --some preliminary findings. George Mason University School of public policy Fangmeng (Tim) Tian 10/19/2010. Introduction. A PhD candidate of policy study A student of migration Focus on skilled emigration

E N D
Migration of Chinese scientists and their productivity 1998-2006--some preliminary findings George Mason University School of public policy Fangmeng (Tim) Tian 10/19/2010
Introduction • A PhD candidate of policy study • A student of migration • Focus on skilled emigration • Target population: Chinese scientists in the Jiaotong 500 universities
Literature review I- Brain drain’s negative impacts • Lose skilled labor (Bhagwati et al 1974) • Reduce economic scale (Miyagiwa1991) • Change skill composition (Haque & Kim 1995) • Distorting learning incentive (Maria & Stryszowski, 2009) • Hinder human capital accumulation (Wong & Yip, 1999) • Critique: many mathematical models, unrealistic assumptions, a few empirical studies
Literature review II- Brain circulation’s positive impacts • From human-capital approach to network approach, particularly relevant to S&T • At least some emigrants return and bring back capital and technology (Kapur, et al. 2001; Saxenian, 2005). • The diaspora send back remittance and transfer knowledge (Ratha 2003; Thorn and Nielsen 2006 ). • Critique: more about organizations than individuals; lack of systemic evidence
Research design • Central question: How did migration of scientists affect Chinese researchers’ productivity and China’s science development in the period 1998 – 2006? • Research goals 1. evaluate the benefits of return migration and the scientific diaspora 2. examines the role of international migration on scientists’ productivity and career development • Three data sources survey + CV + bibliometric data
Selected key questions • What were China’s direct and potential losses due to emigration of its students and scientists? • Were the scientists exchange between the U.S., China, and other foreign countries positively or negatively selected? • What kind of emigrant scientists are more likely to collaborate with domestic scholars? • Did returnees experience a productivity loss after they went back to China? • How much did returnees obtain productivity gain by overseas experience in the short and long term?
Independent variables • Age/cohort (gra-year of BS) • Quality of doctoral education (university ranking of highest degree) • Working environment (research ranking of affiliated university) • Professional status (assistant prof.-full prof.) • Field: physics, biology, chemstry, math • Migration status (stayers, returnees, emigrants)
Target Population • A scientist in the sample is required to be a Chinese researcher currently employed by a global leading university in the English academia. • Chinese: those who were born in mainland China, and obtained a BS degree (Bachelor of Science) at a Chinese university after 1978. • English academia: United States, United Kingdom, Canada, Australia, New Zealand, Hong Kong and Singapore + mainland China • Global leading university: around 250 top universities in the seven English-speaking countries and about 20 Chinese universities • Only four fields: math, physics, chemistry, biology
Data Collection – Survey, CV, and SCI • The population size is about 7000: 5500 domestic scientists and 1500 overseas scientists. • By far I generated a sample of 305 scientists, all of whom got their PhD before 2008. • Collect SCI publication records in 1998, 2002, and 2006 • Citation counts of each paper in the following three years • Collaboration with China/foreign partner of each paper
Education background1 1/3 of the scientists got their highest degree abroad (including Hong Kong). * Including CAS
Migration status *Returnee: those who got an overseas PhD degree. If we define returnees as those who stayed abroad for at least two years, then the return rate can be boosted to over 50%.
Affiliation in 2006 * Including CAS
Regression analysis • Using individual general productivity as the dependent variable, I found migration status (stayer, returnee, emigrant) is highly signficant. • The dummy value “returnee” is negative, which might indicate that returnees are negatively selected, after other factors are controlled.
Tentative conclusions • Chinese scientists live in a merit-based world, and the road to a prestigious position is highly selective. • In terms of both quantity and quality, the productivity gap between domestic and overseas Chinese is getting narrower. • International collaboration has grown proportionally between domestic and overseas Chinese. • Returnees contribute a lot to the research activities in China, but they might be negatively selected compared with emigrants.
What I’m going to do next… • Second wave of survey and expand the sample to be 500 observations. • Weigh the sample to be more representative • Decompose the change of research output • Design a mathematical model and explain the conditions for an optimal research output • Estimate the research output under different conditions
Thank you! • Questions and comments?