Download
1 / 1
10 likes | 188 Views
Java Based Visualizer for BeoSim. Michael Bassily SURE 2004 Advisor: Dr. Ligon. Visualizer Constructs. Background What is BeoSim?. New All Native java: AWT and SWING Data structure at most the size of number of time stamps. New Visualizer Components. OLD

E N D
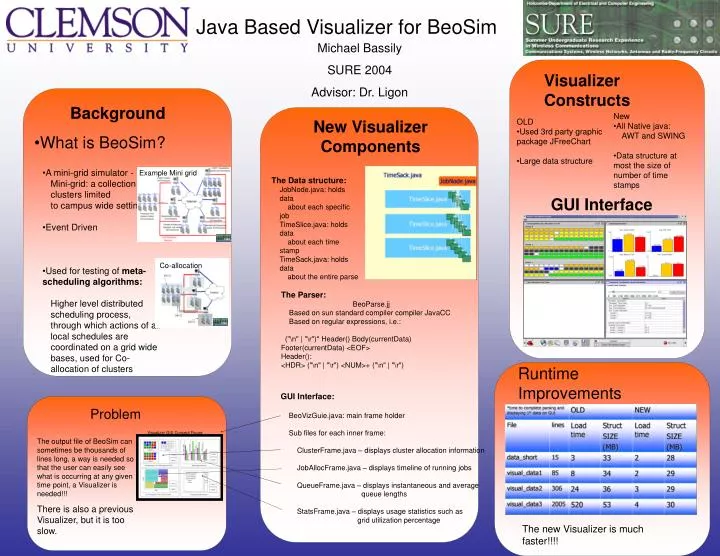
Java Based Visualizer for BeoSim Michael Bassily SURE 2004 Advisor: Dr. Ligon Visualizer Constructs • Background • What is BeoSim? • New • All Native java: • AWT and SWING • Data structure at most the size of number of time stamps New Visualizer Components • OLD • Used 3rd party graphic package JFreeChart • Large data structure • A mini-grid simulator - • Mini-grid: a collection of clusters limitedto campus wide setting • Event Driven • Used for testing of meta-scheduling algorithms: • Higher level distributed scheduling process, through which actions of all local schedules are coordinated on a grid wide bases, used for Co-allocation of clusters Example Mini grid • The Data structure: • JobNode.java: holds data • about each specific job • TimeSlice.java: holds data • about each time stamp • TimeSack.java: holds data • about the entire parse GUI Interface Co-allocation • The Parser: • BeoParse.jj • Based on sun standard compiler compiler JavaCC • Based on regular expressions, i.e.: • ("\n" | "\r")* Header() Body(currentData) Footer(currentData) <EOF> • Header(): • <HDR> ("\n" | "\r") <NUM>+ ("\n" | "\r") Runtime Improvements • GUI Interface: • BeoVizGuie.java: main frame holder • Sub files for each inner frame: • ClusterFrame.java – displays cluster allocation information • JobAllocFrame.java – displays timeline of running jobs • QueueFrame.java – displays instantaneous and average • queue lengths • StatsFrame.java – displays usage statistics such as • grid utilization percentage Problem Visualizer GUI Concept Figure The output file of BeoSim can sometimes be thousands of lines long, a way is needed so that the user can easily see what is occurring at any given time point, a Visualizer is needed!!! There is also a previous Visualizer, but it is too slow. The new Visualizer is much faster!!!!