Download
1 / 14
160 likes | 405 Views
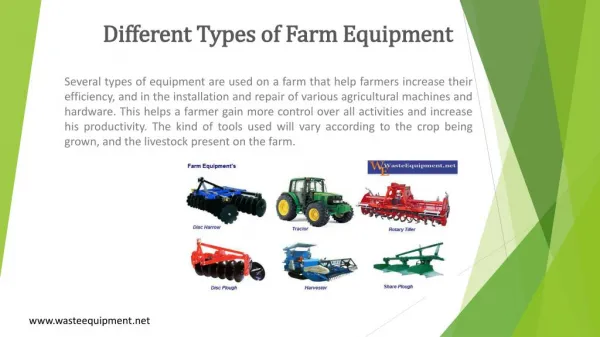
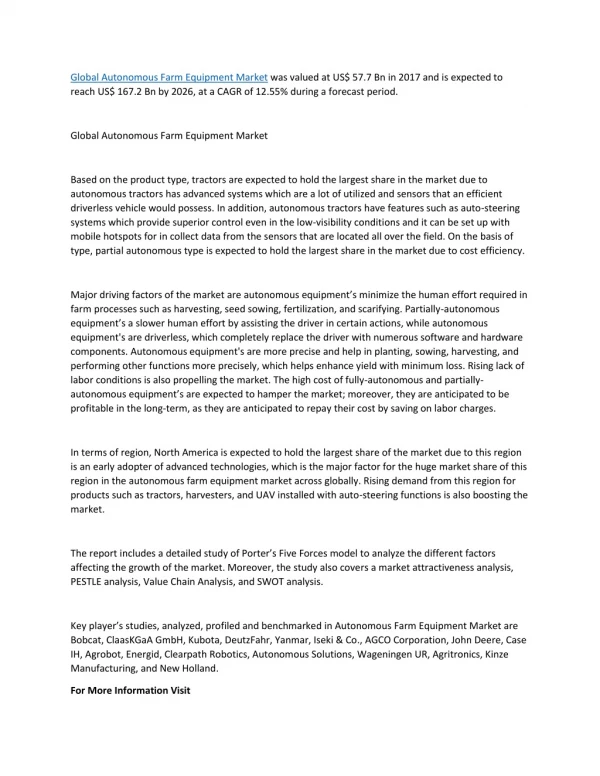
Farm equipment market report provides a detailed analysis on the industry by type, by farming phase and by region. Major products in the market include tractors, tillage equipment, planting equipment, harvesting equipment and so on which is used at different phases of crop production.

E N D
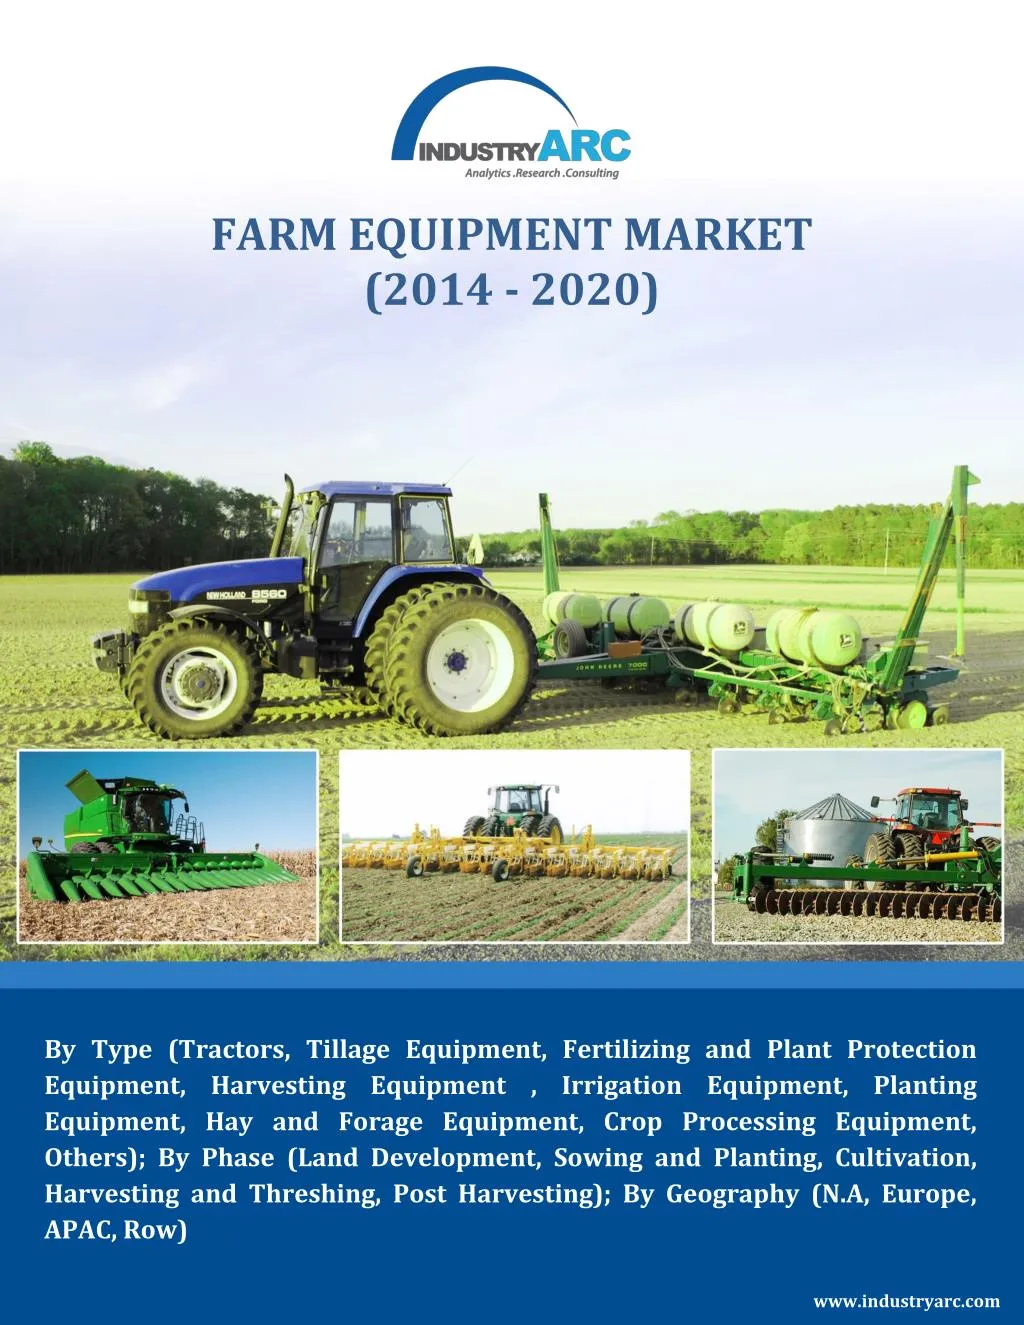
FARM EQUIPMENT MARKET (2014 - 2020) By Type (Tractors, Tillage Equipment, Fertilizing and Plant Protection Equipment, Harvesting Equipment , Irrigation Equipment, Planting Equipment, Hay and Forage Equipment, Crop Processing Equipment, Others); By Phase (Land Development, Sowing and Planting, Cultivation, Harvesting and Threshing, Post Harvesting); By Geography (N.A, Europe, APAC, Row) www.industryarc.com
To Enquire About the Report Click Here TABLE OF CONTENTS 1.Executive Summary 2.Farm Equipment– Market Overview 2.1.Agricultural Land and Farm Mechanization 2.2.Evolution of Farm Equipment 2.3.Classification of Farm Equipment 2.4.Stakeholders 3.Farm Equipment– Market Landscape 3.1.Market Share Analysis 3.2.Comparative Analysis 3.2.1.Product Benchmarking 3.2.2.End user profiling 3.2.3.Patent Analysis 3.2.4.Top 5 Financials Analysis 4.Farm Equipment Market– Market Forces 4.1.Market Drivers 4.1.1.New Technology to increase production 4.1.2.Increasing government subsidy on agricultural machinery 4.1.3.Increase in precision farming to drive mechanization 4.1.4.Access to easy credit for small farmers drive adoption 4.2.Market Constraints 4.2.1.Long Replacement cycle acts as a hindrance in developed regions 4.3.Market Challenges 4.3.1.Attracting small scale farms towards automated farm equipment 4.4.Attractiveness of the Agriculture Equipment Industry 4.5.Power of Suppliers 4.6.Power of Customers 4.7.Threats from New entrants 4.8.Threat of Substitution
To Enquire About the Report Click Here 4.9.Degree of Competition 5.Agriculture Equipment Market – Strategic Analysis 5.1.Value Chain Analysis 5.2.Pricing Analysis 5.3.Opportunities Analysis 5.4.Product/Market Life Cycle Analysis 5.5.Suppliers and Distributors 6.Government Regulations and Support 7.Agriculture Equipment Market : By Type 7.1.Introduction 7.2.By Type 7.3.Tractors 7.4.Tillage Equipment 7.5.Planting Equipment 7.6.Fertilizing and Plant protection Equipment 7.7.Irrigation Equipment 7.8.Harvesting Equipment 7.8.1.Combine Harvesters 7.8.2.Threshers 7.8.3.Others 7.9.Hay and Forage Equipment 7.10.Crop processing Equipment 7.11.Others 8.Agriculture Equipment Market: By Phase 8.1.Land development 8.2.Sowing and planting 8.3.Cultivation 8.4.Harvesting and Threshing 8.5.Post harvesting
To Enquire About the Report Click Here 9.Agriculture Equipment Market : Geographic Analysis 9.1.North America 9.1.1.U.S. 9.1.2.Canada 9.1.3.Mexico 9.2.Europe 9.2.1.Germany 9.2.2.France 9.2.3.Italy 9.2.4.U.K. 9.2.5.Russia 9.2.6.Turkey 9.2.7.Poland 9.2.8.Rest Of Europe 9.3.APAC 9.3.1.China 9.3.2.India 9.3.3.Japan 9.3.4.Australia 9.3.5.Rest Of APAC 9.4.Rest of the World 9.4.1.Brazil 9.4.2.Argentina 9.4.3.Others 10.Market Entropy 10.1.Dominant strategy 10.2.New Product Launches 10.3.M&As 10.4.Collaborations, JVs and Partnerships
To Enquire About the Report Click Here 11.Company Profile 11.1.Alamo Group Inc. 11.2.Agco Corporation 11.3.Argo S. p. A 11.4.Amazone H. Dreyer GmbH & Co. KG 11.5.Bucher Industries 11.6.Class KGaA mbH 11.7.CNH Industrial N.V. 11.8.Daedong Industrial Company Ltd. 11.9.Deere & Company 11.10.Escorts Group 11.11.Exel industries 11.12.Iseki & Co., Ltd. 11.13.Kubota Corporation 11.14.Kverneland Group 11.15.Mahindra & Mahindra Ltd. 11.16.Netafim Ltd 11.17.SAME Deutz-Fahr S. p. A 11.18.Tractors and Farm Equipment Limited 11.19.Yanmar Co, Ltd. 11.20.Zetor Tractors A.S 12.Appendix 12.1.Abbreviations 12.2.Sources 12.3.Research Methodology 12.4.Bibliography 12.5.Compilation of Expert Insights 12.6.Disclaimer
To Enquire About the Report Click Here LIST OF TABLES Table 1 Table 2 Table 3 Table 4 Table 5 Table 6 Table 7 Table 8 Table 9 Table 10 Table 11 Global Farm Equipment Market, List of Companies Covered Global Farm Equipment Market Competitive Share Analysis, 2014 (%) Top 5 Market Players Financials Analysis Global Farm Equipment Market Revenue, By Type, 2014-2020 ($M) Global Farm Equipment Market Volume, By Type, 2014-2020 (Units) Global Farm Equipment Market Revenue, By Phase, 2014-2020 ($M) Global Farm Equipment Market Revenue, By Region, 2014-2020 ($M) Global Tractor Market Revenue, By Region, 2014-2020($M) Global Tillage Equipment Market Revenue, By Region, 2014-2020($M) Global Planting Equipment Market Revenue, By Region, 2014-2020($M) Global Fertilizing and Plant Protection Equipment Market Revenue, By Region, 2014- 2020($M) Table 12 Table 13 Table 14 Table 15 Table 16 Table 17 Global Irrigation Equipment Market Revenue, By Region, 2014-2020($M) Global Harvesting Equipment Market Revenue, By Region, 2014-2020($M) Global Hay and Forage Equipment Market Revenue, By Region, 2014-2020($M) Global Crop Processing Equipment Market Revenue, By Region, 2014-2020($M) Global Other Equipment Market Revenue, By Region, 2014-2020($M) Global Land Development Farm Equipment Market Revenue, By Region, 2014-2020 ($M) Table 18 Global Sowing and Planting Farm Equipment Market Revenue, By Region, 2014-2020 ($M) Table 19 Table 20 Global Cultivation Farm Equipment Market Revenue, By Region, 2014-2020 ($M) Global Harvesting and Threshing Farm Equipment Market Revenue, By Region, 2014- 2020 ($M) Table 21 Global Post Harvesting Farm Equipment Market Revenue, By Region, 2014-2020 ($M) Table 22 Table 23 Table 24 Table 25 North America Farm Equipment Market Revenue, By Type, 2014-2020 ($M) North America Farm Equipment Market Volume, By Type, 2014-2020 (Units) North America Farm Equipment Market Revenue, By Phase, 2014-2020 ($M) North America Farm Equipment Market Revenue, By Country, 2014-2020 ($M)
To Enquire About the Report Click Here Table 26 North America Farm Equipment Market Volume, By Country, 2014- 2020 (Units) Table 27 Table 28 Table 29 Table 30 Table 31 Table 32 Table 33 Table 34 Table 35 Table 36 Table 37 Table 38 Table 39 Table 40 Table 41 Table 42 Table 43 Table 44 Table 45 Table 46 Table 47 Table 48 Table 49 Table 50 Table 51 Table 52 Table 53 Table 54 Table 55 Table 56 U.S. Farm Equipment Market Revenue, By Type, 2014-2020 ($M) U.S. Farm Equipment Market Volume, By Type, 2014-2020 (Units) Canada Farm Equipment Market Revenue, By Type, 2014-2020 ($M) Canada Farm Equipment Market Volume, By Type, 2014-2020 (Units) Mexico Farm Equipment Market Revenue, By Type, 2014-2020 ($M) Mexico Farm Equipment Market Volume, By Type, 2014-2020 (Units) Europe Farm Equipment Market Revenue, By Type, 2014-2020 ($M) Europe Farm Equipment Market Volume, By Type, 2014-2020 (Units) Europe Farm Equipment Market Volume, By Phase, 2014-2020 ($M)) Europe Farm Equipment Market Revenue, By Country, 2014-2020 ($M) Europe Farm Equipment Market Volume, By Country, 2014-2020 (Units) Germany Farm Equipment Market Revenue, By Type, 2014-2020 ($M) Germany Farm Equipment Market Volume, By Type, 2014-2020 (Units) France Farm Equipment Market Revenue, By Type, 2014-2020 ($M) France Farm Equipment Market Volume, By Type, 2014-2020 (Units) Italy Farm Equipment Market Revenue, By Type, 2014-2020 ($M) Italy Farm Equipment Market Volume, By Type, 2014-2020 (Units) U.K. Farm Equipment Market Revenue, By Type, 2014-2020 ($M) U.K. Farm Equipment Market Volume, By Type, 2014-2020 (Units) Russia Farm Equipment Market Revenue, By Type, 2014-2020 ($M) Russia Farm Equipment Market Volume, By Type, 2014-2020 (Units) Poland Farm Equipment Market Revenue, By Type, 2014-2020 ($M) Poland Farm Equipment Market Volume, By Type, 2014-2020 (Units) Turkey Farm Equipment Market Revenue, By Type, 2014-2020 ($M) Turkey Farm Equipment Market Volume, By Type, 2014-2020 (Units) Rest of Europe Farm Equipment Market Revenue, By Type 2014-2020 ($M) Rest of Europe Farm Equipment Market Volume, By Type 2014-2020 (Units) APAC Farm Equipment Market Revenue, By Type 2014-2020 ($M) APAC Farm Equipment Market Volume, By Type 2014-2020 (Units) APAC Farm Equipment Market Revenue, By Phase 2014-2020 ($M)
To Enquire About the Report Click Here Table 57 APAC Farm Equipment Market Revenue, By Country 2014-2020 ($M) Table 58 Table 59 Table 60 Table 61 Table 62 Table 63 Table 64 Table 65 Table 66 Table 67 Table 68 Table 69 Table 70 Table 71 Table 72 Table 73 Table 74 Table 75 Table 76 Table 77 Table 78 APAC Farm Equipment Market Volume, By Country, 2014-2020 (Units) China Farm Equipment Market Revenue, By Type 2014-2020 ($M) China Farm Equipment Market Volume, By Type 2014-2020 (Units) India Farm Equipment Market Revenue, By Type 2014-2020 ($M) India Farm Equipment Market Volume, By Type 2014-2020 (Units) Japan Farm Equipment Market Revenue, By Type 2014-2020 ($M) Japan Farm Equipment Market Volume, By Type 2014-2020 (Units) Rest OF APAC Farm Equipment Market Revenue, By Type 2014-2020 ($M) Rest OF APAC Farm Equipment Market Volume, By Type 2014-2020 (Units) RoW Farm Equipment Market Revenue, By Type 2014-2020 ($M) RoW Farm Equipment Market Volume, By Type 2014-2020 (Units) RoW Farm Equipment Market Revenue, By Phase 2014-2020 ($M) RoW Farm Equipment Market Revenue, By Country 2014-2020 ($M) RoW Farm Equipment Market Volume, By Country, 2014-2020 (Units) Brazil Farm Equipment Market Revenue, By Type 2014-2020 ($M) Brazil Farm Equipment Market Volume, By Type 2014-2020 (Units) Argentina Farm Equipment Market Revenue, By Type 2014-2020 ($M) Argentina Farm Equipment Market Volume, By Type 2014-2020 (Units) Others Farm Equipment Market Revenue, By Type 2014-2020 ($M) Others Farm Equipment Market Volume, By Type 2014-2020 (Units) M&A, JV, Agreements, Farm Equipment Market
To Enquire About the Report Click Here LIST OF FIGURES Figure1 Figure2 Figure3 Figure4 Figure5 Figure6 Figure7 Figure8 Figure9 Figure10RoW Farm Equipment Market Share, By Country, 2014 (%) Figure11Global Farm Equipment Market Recent Developments, By Year, 2011-2014 Global Farm Equipment Market, By Geography, 2014 - 2020 ($M) Segmentation of Global Farm Equipment Market Global Farm Equipment Market Competitive Share Analysis, 2014(%) Global Farm Equipment Market Share, By Type, 2014 (%) Global Farm Equipment Market Share, By Phase, 2014 (%) Global Farm Equipment Market Share, By Geography, 2014 (%) APAC Farm Equipment Market Share, By Country, 2014 (%) Europe Farm Equipment Market Share, By Country, 2014 (%) North America Farm Equipment Market Share, By Country, 2014 (%)
To Enquire About the Report Click Here KEY INSIGHTS Farm equipment market is growing very rapidly with increasing demand for produce and increasing mechanized farming The revenue market is estimated to exhibit a faster growth as compared to shipments growth Tractors are the most dominant product type in the farm equipment market Asia-Pacific is the dominant region by shipments and exhibiting the speedy growth due to the fast growing countries such as China and India China to overtake the U.S. in terms of production and sales of farm equipment by 2017 The farm equipment market is expected to grow at a CAGR of 7.5% from 2014-2020 Asia Pacific and North America are said be growing the fastest regional markets, where as Europe and ROW are expected to grow at a lesser rate than the former two In developing countries such as India and Brazil the adoption of the farm equipment in increasing at a significant rate The U.S., China and India are to be witnessed as the fastest and steadiest growing markets which constitute a high share in the farm equipment market. The driving demand for the farm equipment market is the increase in the global population, increase in the mechanization of the farm equipment and reduced labour availability.
To Enquire About the Report Click Here RESEARCH METHODOLOGY The quantitative and qualitative data collected for the global Farm Equipment market report is from a combination of secondary and primary sources. Research interviews were conducted with executives and/or mangers in the key product manufacturers and related organizations. These Key Opinion Leaders (KOLs) were then provided a questionnaire to gather quantitative and qualitative inputs on their operations, performance, strategies and views on the overall market, including key developments and trends. Data from interviews is consolidated, checked for consistency and accuracy, and the final market numbers are again validated by experts. The global Farm Equipment market was split by grades of polycarbonate resins, applications and geography based on different factors like primary and secondary sources, understanding of the number of companies operating in each segment and also KOL insights. We have used various secondary sources such as directories, articles, white papers, newsletters, annual reports and paid databases such as OneSource, Hoovers and Factiva to identify and collect information for extensive commercial study of the global Farm Equipment market. The approach towards finding information regarding the market and forecasting has been quite extensive. The key players in the market and its value chain were identified through secondary research and their market opinions were also gathered in a similar way through telephonic interviews and questionnaires. Interviews with key opinion leaders such as managers and marketing personnel were used extensively in understanding the need and emergence of polycarbonate resin market. We also have extensive database of contacts which were used to conduct primary interviews and also to get their inputs using questionnaires.
To Enquire About the Report Click Here THE ARC ADVANTAGE An analytical model lies at the core of our process, ensuring logical consistency throughout our research. We complement the model with secondary data and interviews with industry experts to reflect the latest trends. With our final expert validation, we provide you with only the most accurate and actionable intelligence. THE ARC PROCESS Base Method Analytical Method Consolidation Method Delphi Verification 1. Granular breakdown of drivers into factors 2. Validate all factors in terms of their present impact on the market 3. Assign weights to these factors in terms of their relevance and impact on the market 4. Build the Analytical Model 1. Get a top- down estimate of the market 2. Follow it up with a bottom-up estimate of the market 3. Check forconsistency and new growth factors that are relevant over the next 10 Years 4. Build the Base model 1. Granular breakdown of drivers into factors 2. Validate all factors in terms of their present impact on the market. 3. Assign weights to these factors in terms of their relevance and impact on the market. 4. Build the Consolidated Model 1. Verify the findings of the model with experts from across the value chain 2. Verify the findings with players across small and large enterprises 3. Tweak the model and add new factors 4. Finalize the ARC Model ANALYTICAL MODEL BASE MODEL CONSOLIDATED MODEL ARC MODEL
To Enquire About the Report Click Here ABOUT US IndustryARC was started by a group of young, passionate professionals along with extensively experienced industry veterans across various business segments. Our focus and expertise is mainly in the field of analytics, market research and consulting. Our singular goal is to provide accurate and affordable research to our clients. Our research team has expertise in diverse fields like Automotive, Chemicals,Consumer Product & Services, Electronics, Food & Beverages, Healthcare etc., However diverse the expertise maybe, everyone in our team shares one common trait - we love data and we love providing solutions to clients using that data even more! Seeing your business flourish based on our solutions and strategy is what we love the most! IndustryARC publishes more than 30 reports on an annual basis in the mentioned Industries. Our reports are in-depth and high quality reports that can help decision makers frame better strategies for their business requirements. These reports can be further customized as per your needs. Disclaimer: The reports sold by IndustryARC are limited publications containing valuable market information provided to a select group of customers in response to orders. Our customers acknowledge and agree that any report bought from IndustryARC is for their own internal use and not for general publication or disclosure to third parties. Our reports or part of the reports, information contained in the report, cannot be shared or resold to any other third party. Disclosure to third parties, usage of data in a public document, article or blog by the customer can be done with prior permission taken from IndustryARC. For information regarding permissions and sales, contact: sales@industryarc.com | sanjay.matthews@industryarc.com
To Enquire About the Report Click Here IndustryARC +1 614 - 588 - 8538 sales@industryarc.com Copyright ©2015 IndustryARC All Rights Reserved. This document contains highly confidential information and is the sole property of IndustryARC. No part of it may be circulated, copied, quoted, or otherwise reproduced without the approval of IndustryARC.