Download
1 / 36
1.15k likes | 3.24k Views
Categories of New Products. New-To-The-World. New Product Lines. Six Categories of New Products. Product Line Additions. Improvements/Revisions. Repositioned Products. Lower-Priced Products. New Product Introductions. New Formulation 47.1% Positioning 39.1 Packaging 8.6

E N D
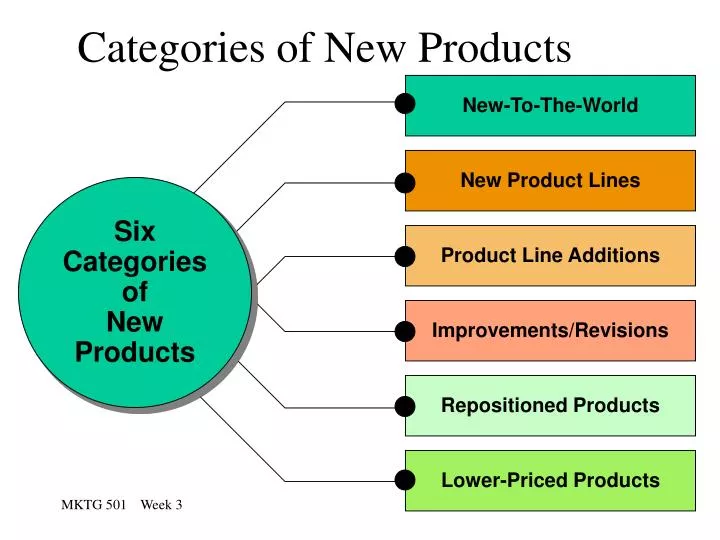
Categories of New Products New-To-The-World New Product Lines Six Categories of New Products Product Line Additions Improvements/Revisions Repositioned Products Lower-Priced Products
New Product Introductions • New Formulation 47.1% • Positioning 39.1 • Packaging 8.6 • New Market 3.4 • Technology 1.1
New Product Development Process New Product Strategy Idea Generation Idea Screening Business Analysis Development Test Marketing Commercialization New Product
Why Some New Products Succeed Failure Factors Poor match between product and market needs Overestimation of market size Incorrect positioning Inappropriate price Inadequate distribution Poor promotion Success Factors Good match between product and market needs Adequate target market size Offers a clear, meaningful benefit Distinguishable from substitute products Offers unique, superior value Organizational commitment to new product development
The Product Life Cycle Introductory Stage Growth Stage Maturity Stage Decline Stage Product Category Sales Dollars Product Category Profits 0 Time
The Importance of New Products New product 1 New product 2 Sales volume Sales volume Dollars Profits Profits + 0 – Time
Adopters’ Categories ADOPTERS’ CATEGORIES BASED ON INNOVATIVENESS Percentage of Adopters Early Adopters 13.5% Late Majority 34% Early Majority 34% Laggards 16% Innovators 2.5% Time
The Diffusion Process Relationship of the Diffusion Process to the Product Life Cycle Introduction Growth Decline Maturity 100 90 80 70 60 50 40 30 20 10 0 Product life cycle curve Early majority Cumulative Percentage of Adoption Late majority Early adopters Innovators Laggards Diffusion curve Time of Adoption of Innovations
Rate of Adoption Complexity Compatibility Characteristics Affecting New Product Diffusion Relative Advantage Observability Trialability
Unique Characteristics of Services Intangibility Characteristics That Distinguish Services Inseparability Heterogeneity Perishability
Core & Supplementary Services for Federal Express Advice and information Problem solving Order taking Overnight transportation and delivery of packages Billing statements Supplies Tracing Pickup Documentation Source: Adapted from Christopher H. Lovelock, Services Marketing, 2nd Ed., (Englewood Cliffs, NJ: Prentice-Hall, 1991), p.18.
Four Promotion Strategies for Services Stressing Tangible Cues Using Personal Information Sources Common Strategies to Promote Services Creating a Strong Organizational Image Engaging in Postpurchase Communication
Three Levels of Relationship Marketing Potential for long-term advantage over competitors Degree of service customization Main element of marketing mix Type of bond Level One Financial Low Price Low Personal communications Two Financial and social Medium Medium High Three Financial, social, and structural Medium to high Service delivery
Customer Value ) ( Benefits ________ Customer Value = Perception of Sacrifices
Creating Customer Value • Offer products that perform • Give customers more than they expect • Avoid unrealistic pricing • Give the buyer facts • Offer organization-wide commitment in service and after-sales support
The Customer Value Triad Value-Based Prices Goods Quality Service Quality Source: Adapted from Earl Naumann, Creating Customer Value (Cincinnati, OH: Thomson Executive Press, 1994), p. 17.
Techniques of Quality Improvement Quality Functional Deployment Benchmarking Essential TQM Techniques Continuous Improvement Reduced Cycle Time Analysis of Process Problems
Components of Service Quality Reliability Responsiveness Components of Service Quality Assurance Empathy Tangibles
The Gap Model of Service Quality Customer Expected Service (Gap 5) Perceived Service Service Delivery Communication with Customers Provider (Gap 4) (Gap 1) (Gap 3) Service Quality Specifications (Gap 2) Management Perceptions
Economic Effects of Customer Loyalty Lower Acquisition Costs Base Profit How Customer Loyalty Helps Companies Revenue Growth Cost Savings Referrals Price Premium
Conventional/Traditional Distribution Channel for Consumer Goods Wholesaler Retailer The Consumer Manufacturer
Distribution Channel for Consumer Goods with Large Retailers Wholesaler Retailer The Consumer Manufacturer
Direct Distribution Channel for Consumer Goods Wholesaler Retailer The Consumer Manufacturer
Indirect Distribution Channel for Business to Business Goods Industrial Distributor User/OEM/ Manufacturer
Direct Distribution Channel for Business to Business Goods Industrial Distributor User/OEM/ Manufacturer
Elements of Successful Channels • Pooled Resources • team concept; shared risk/reward • Collective Goals • often driven by a “channel captain” • Connected System • from demand forecast to end delivery/service • Flexibility • substitute players; ability to survive changes
Evolution of Marketing Concept:Implications for Channels • Production Era • moving raw materials and product in the new industrial age was important catalyst • Institutional Period (selling orientation) • need to “move the product” (I.e., “sell”) • Marketing Concept • make what you can market; too “reactionary?” • Relationship Marketing • highly interactive; proactive mgmt of relations
Channel Functions • Contact Efficiency • Routinization • Sorting • Categorizing • Breaking Bulk • Minimizing Uncertainty • Need (intermediaries closer to market) • Market (rapidly changing markets; unclear sources) • Transaction (timing; reliability • Each of these uncertainties diminishes over time; as channel members develop standards, relationships, and norms
Contact Efficiency S S S S Direct Only = 12 transactions B B B S S S S With 1 intermediary = 7 transactions I B B B
Types of Wholesalers Possess Title Negot Promo • Merchant Wholesalers Y Y Y Y • independently owned • Mfgr’s Sales Orgs. N Y Y Y • Producer-owned • Agents/Brokers N N Y Y • mfgrs reps, auction houses • paid on commission • Commission Merchants Y N Y Y
How Retailers Create Value - Right Merchandise - Good Shopping Atmosphere - Decreased Shopping Risk - Convenience Increases Customer Utility Enhances Value Reduces Price - Control of Costs
The Retail Mix • Selling • Service • Store Design • Location • Merchandise • Pricing • Promotion
Challenge of Retail Management Overall Goal: Create value for customers and profit for firm Marketing Objective: Create differential advantage Tasks: Analyze changing environment Select target market Coordinate ele- ments of retail mix
The Margin-Turnover Tradeoff Hi Margin Lo Turnover High Low Margin Lo Margin Hi Turnover Low High Turnover
Competition Among Strategic Groups High Prestige Stores Traditional Dept. Stores Merchandise Offering (quality, selection, fashion, etc.) Mass Merchandisers Upscale Discounters Low Discounters Low High Price
Ways of Creating Differential Advantagewithin Strategic Groups Price Atmosphere & Service Location