Download
1 / 18
180 likes | 186 Views
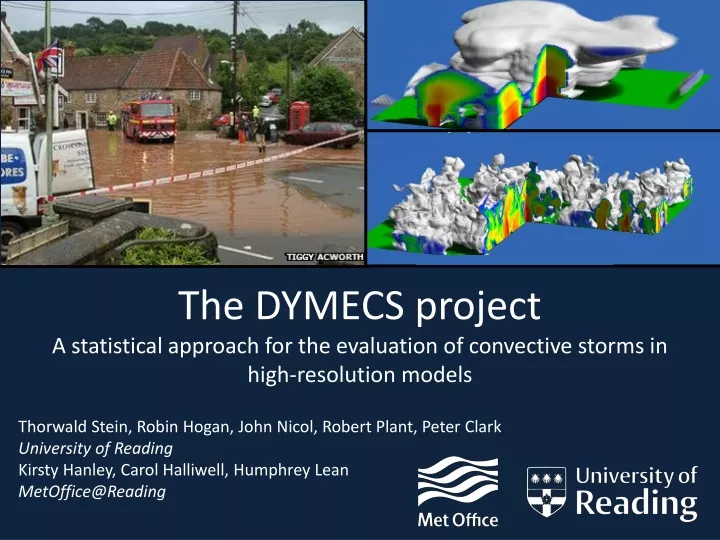
The DYMECS project A statistical approach for the evaluation of convective storms in high-resolution models. Thorwald Stein, Robin Hogan, John Nicol, Robert Plant, Peter Clark University of Reading Kirsty Hanley, Carol Halliwell, Humphrey Lean MetOffice@Reading.

E N D
The DYMECS project A statistical approach for the evaluation of convective storms inhigh-resolution models Thorwald Stein, Robin Hogan, John Nicol, Robert Plant, Peter Clark University of Reading Kirsty Hanley, Carol Halliwell, Humphrey Lean MetOffice@Reading
Finer-scale structures are represented at higher resolutions– but which is a more faithful physical representation? 1500m model 200m model clouds clouds rainfall rainfall
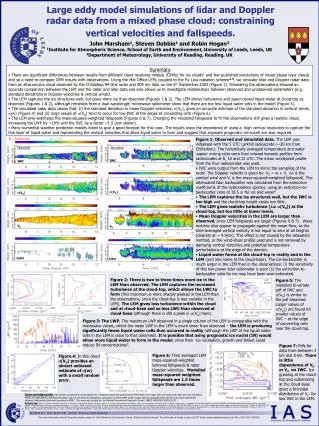
We can estimate storm morphology with radar! 40 days of convective weather in 2011-2012 over southern England.Scanned over 1,000 storms with Chilbolton 3-GHz radar.25-m dish allows for high-resolution observations (~300m). Animation by Robin Hogan
DYMECS: Improve understanding of representation of convective storms in models Track storms in Met Office rainfall radar data and model surface rainfall rate for storm-size distribution and life-cycle analysis. Reconstruct 3D storm volumes from Chilbolton scans of tracked storms and relate to storm volumes in model reconstructed from simulated radar reflectivity. Retrieve updraft strength and width from Doppler velocities in Chilbolton RHI scans using mass-continuity approach and compare with model updraft statistics in storms.
Model setup: One-way nested simulations of the Met Office Unified Model (UM). Grid lengths of 1500m (Met Office operational forecast model, UKV) at 70 levels; 500m, 200m, and 100m (1750 by 1500) at 140 levels. Single-moment, bulk microphysics. Prognostic cloud ice and liquid and rain, prognostic graupel optional (now operational).Forward model radar reflectivities for like-with-like evaluation. 500m, 200m, and 100m simulations run with 3D Smagorinskisubgrid turbulence scheme. log E(k) explicit UM default cs=0.2 (so 40m mixing length at 200m). Vary mixing length to test sensitivity of convective storm representation (300m, 100m, 40m). param log k
The DYMECS project: A statistical approach for the evaluation of convective storms inhigh-resolution models 1. Rainfall feature characteristics
Shower case Deep case 500-m model best 200-m model best 1.5-km model best 200-m model best Hanley et al. (QJRMS, 2015)
Shower case Deep case By decreasing Smagorinsky mixing length, we can produce storm morphologies similar to a higher resolution simulation Hanley et al. (QJRMS, 2015)
1500m:Large storms are too intense 1500m model Radar Rainfall rate Storm diameter Rainfall rate 200m model Storm diameter Rainfall rate 200m: Small storms are too intense Storm diameter Hanley et al. (QJRMS, 2014)
The DYMECS project: A statistical approach for the evaluation of convective storms inhigh-resolution models 2. 3D Storm morphology
Storm 3D volumes(25 August 2012) Radar 1500m 500m Intense small storms? High ice water contentin deep storms? 200m dBZ 100m Stein et al. (MWR, 2014) Stein et al. (BAMS, 2015)
What is the cloud-ice hydrometeor distribution above heavy precipitation? 2D-histogram of reflectivity versus height for profiles with 40-45 dBZ near surface (10 mm/hr). Lines show 25th, 50th and 75th reflectivity percentile for a given height. Observations 200-m Reflectivity distribution with height: Model is more likely to have reflectivities above 30-dBZ for a given height than observations. Model also generates high rainfall rates from low cloud tops too frequently. Stein et al. (MWR, 2014)
The DYMECS project: A statistical approach for the evaluation of convective storms inhigh-resolution models 3. Updraft statistics
How to retrieve updrafts from single Doppler radar Truth Estimate Estimate vertical velocity from vertical profiles of radial velocity, assuming zero divergence across plane. Match quantiles of model 2D estimates to model true vertical velocities – for manyupdrafts! Develop scaling relationship between estimate and truth based on simulations. Nicol et al. (QJRMS, 2015)
1.5-km model mass flux order of magnitude too large Mean vertical velocity as function of radius from centre of updrafts. Set to zero where: w<1m/s OR where values start increasing again (“primary profile”) Stein et al. (BAMS, 2015) Nicol et al. (QJRMS, 2015)
Observations 1500m 500m 200m 100m Simulations do not represent multiple updrafts in a single storm Primary (monotonic) cloud widths proxy for updraft width Nicol et al. (QJRMS, 2015)
Simulations do not represent multiple updrafts in a single storm Observations: Individual primary (monotonic) reflectivity profiles are joined up by larger cloud region with Z>20dBZ. Z>20dBZ 200m and 100m simulations: Individual primary (monotonic) reflectivity profiles remain isolated cells even when monotonicity is relaxed.
Future of the DYMECS framework • “Convection-permitting” O(1km) simulations only permit the largest storms, not the ordinary mid-latitude thunderstorm. • For adequate thunderstorm representation, we need <500m grid length: enter the “turbulent grey zone”… • What controls the size of thunderstorms? (Matt Feist, PhD candidate) • Multi-doppler radar observations to better constrain updraft retrievals (MC3E, future campaigns). • Multi-radar tracking to enable frequent sampling of developing storms for process-based analysis (we cannot rely on LES alone…). • Multi-frequency radar for better IWC constraints (use Doppler spectra when possible? Kollias et al.) • New operational lightning forecast – so thunderstorm representation and graupel are important! (Reading PhD project) The DYMECS radar data are available through the BADC.