Download
1 / 1
10 likes | 155 Views
MRI quantitatively measuring relative blood volume inside CTO in a rabbit model Beiping Qiang , Azriel Osherov , Xiuling Qi , Michelle Ladouceur-Wodzak , Kevan Anderson, Brian K. Courtney, Graham Wright, Bradley Strauss

E N D
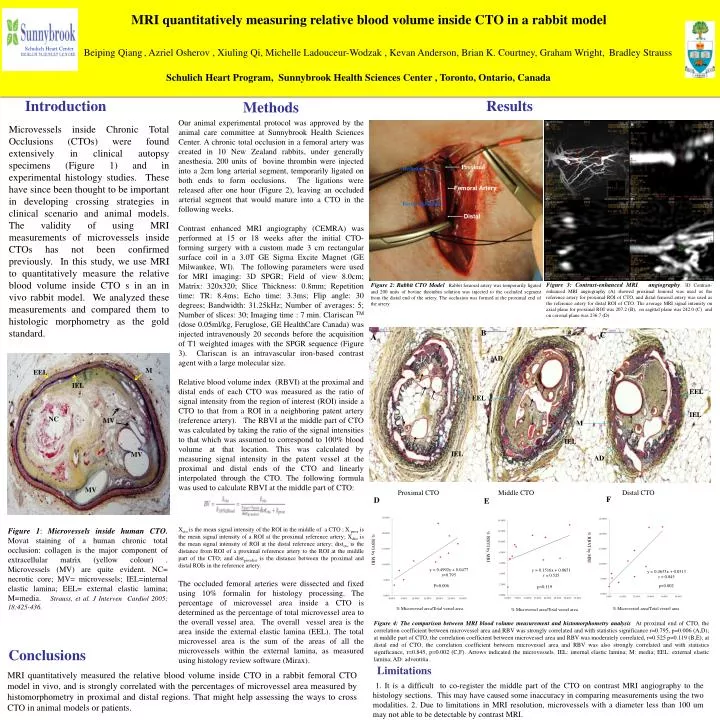
MRI quantitatively measuring relative blood volume inside CTO in a rabbit model Beiping Qiang, Azriel Osherov , XiulingQi, Michelle Ladouceur-Wodzak , Kevan Anderson, Brian K. Courtney, Graham Wright, Bradley Strauss Schulich Heart Program, Sunnybrook Health Sciences Center , Toronto, Ontario, Canada B C A AD FemoralArtery Proximal Reference Distal Reference EEL Middle ROI EEL IEL M Distal ROI FemoralVein Proximal ROI IEL IEL AD A B Proximal CTO Middle CTO Distal CTO Schulich Heart Center % RBVI by MRI % RBVI by MRI Proximal Occlusion NC C Femoral Artery D MV P=0.006 Bovine Thrombin % Microvessel area/Total vessel area % Microvessel area/Total vessel area % Microvessel area/Total vessel area Distal Movat Introduction Results Methods Our animal experimental protocol was approved by the animal care committee at Sunnybrook Health Sciences Center. A chronic total occlusion in a femoral artery was created in 10 New Zealand rabbits, under generally anesthesia. 200 units of bovine thrombin were injected into a 2cm long arterial segment, temporarily ligated on both ends to form occlusions. The ligations were released after one hour (Figure 2), leaving an occluded arterial segment that would mature into a CTO in the following weeks. Contrast enhanced MRI angiography (CEMRA) was performed at 15 or 18 weeks after the initial CTO-forming surgery with a custom made 3 cm rectangular surface coil in a 3.0T GE Sigma Excite Magnet (GE Milwaukee, WI). The following parameters were used for MRI imaging: 3D SPGR; Field of view 8.0cm; Matrix: 320x320; Slice Thickness: 0.8mm; Repetition time: TR: 8.4ms; Echo time: 3.3ms; Flip angle: 30 degrees; Bandwidth: 31.25kHz; Number of averages: 5; Number of slices: 30; Imaging time : 7 min. Clariscan TM (dose 0.05ml/kg, Feruglose, GE HealthCare Canada) was injected intravenously 20 seconds before the acquisition of T1 weighted images with the SPGR sequence (Figure 3). Clariscan is an intravascular iron-based contrast agent with a large molecular size. Relative blood volume index (RBVI) at the proximal and distal ends of each CTO was measured as the ratio of signal intensity from the region of interest (ROI) inside a CTO to that from a ROI in a neighboring patent artery (reference artery). The RBVI at the middle part of CTO was calculated by taking the ratio of the signal intensities to that which was assumed to correspond to 100% blood volume at that location. This was calculated by measuring signal intensity in the patent vessel at the proximal and distal ends of the CTO and linearly interpolated through the CTO. The following formula was used to calculate RBVI at the middle part of CTO: Xcto is the mean signal intensity of the ROI in the middle of a CTO ; X prox is the mean signal intensity of a ROI at the proximal reference artery; Xdist is the mean signal intensity of ROI at the distal reference artery; distcto is the distance from ROI of a proximal reference artery to the ROI at the middle part of the CTO; and distproxdist is the distance between the proximal and distal ROIs in the reference artery. The occluded femoral arteries were dissected and fixed using 10% formalin for histology processing. The percentage of microvessel area inside a CTO is determined as the percentage of total microvessel area to the overall vessel area. The overall vessel area is the area inside the external elastic lamina (EEL). The total microvessel area is the sum of the areas of all the microvessels within the external lamina, as measured using histology review software (Mirax). Microvessels inside Chronic Total Occlusions (CTOs) were found extensively in clinical autopsy specimens (Figure 1) and in experimental histology studies. These have since been thought to be important in developing crossing strategies in clinical scenario and animal models. The validity of using MRI measurements of microvessels inside CTOs has not been confirmed previously. In this study, we use MRI to quantitatively measure the relative blood volume inside CTO s in an in vivo rabbit model. We analyzed these measurements and compared them to histologic morphometry as the gold standard. Figure 2: Rabbit CTO Model Rabbit femoral artery was temporarily ligated and 200 units of bovine thrombin solution was injected to the occluded segment from the distal end of the artery. The occlusion was formed at the proximal end of the artery. M EEL IEL MV MV Figure 1: Microvessels inside human CTO. Movat staining of a human chronic total occlusion: collagen is the major component of extracellular matrix (yellow colour) . Microvessels (MV) are quite evident. NC= necrotic core; MV= microvessels; IEL=internal elastic lamina; EEL= external elastic lamina; M=media. Strauss, et al. J Interven Cardiol 2005; 18:425-436. Figure 4: The comparison between MRI blood volume measurement and histomorphometry analysis At proximal end of CTO, the correlation coefficient between microvessel area and RBV was strongly correlated and with statistics significance r=0.795, p=0.006 (A,D); at middle part of CTO, the correlation coefficient between microvessel area and RBV was moderately correlated, r=0.525 p=0.119 (B,E); at distal end of CTO, the correlation coefficient between microvessel area and RBV was also strongly correlated and with statistics significance, r=0.845, p=0.002 (C,F). Arrows indicated the microvessels. IEL: internal elastic lamina; M: media; EEL: external elastic lamina; AD: adventitia. Figure 3: Contrast-enhanced MRI angiography. 3D Contrast-enhanced MRI angiography (A) showed proximal femoral was used as the reference artery for proximal ROI of CTO, and distal femoral artery was used as the reference artery for distal ROI of CTO. The average MRI signal intensity on axial plane for proximal ROI was 207.2 (B), on sagittal plane was 242.0 (C) and on coronal plane was 236.7 (D). F D E % RBVI by MRI Conclusions Limitations MRI quantitatively measured the relative blood volume inside CTO in a rabbit femoral CTO model in vivo, and is strongly correlated with the percentages of microvessel area measured by histomorphometry in proximal and distal regions. That might help assessing the ways to cross CTO in animal models or patients. 1. It is a difficult to co-register the middle part of the CTO on contrast MRI angiography to the histology sections. This may have caused some inaccuracy in comparing measurements using the two modalities. 2. Due to limitations in MRI resolution, microvessels with a diameter less than 100 um may not able to be detectable by contrast MRI.