Download
1 / 25
250 likes | 391 Views
NAE 4D-Var – Testing and Issues EWGLAM/SRNWP meeting Zurich 9 th -12 th October 2006. Mark Naylor Data Assimilation, NWP. NAE 4DVar. The Met Office’s 4DVar NAE went operational on the 14 th March 2006 after much testing and tuning. We will present results from:-

E N D
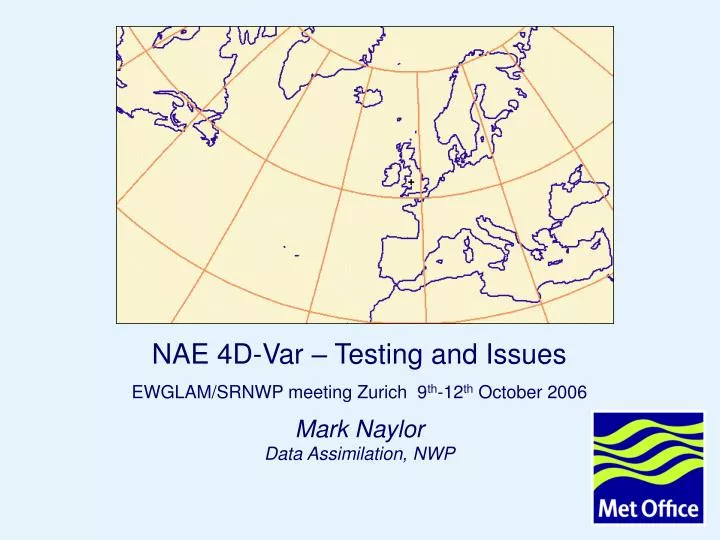
NAE 4D-Var – Testing and Issues EWGLAM/SRNWP meeting Zurich 9th-12th October 2006 Mark Naylor Data Assimilation, NWP
NAE 4DVar The Met Office’s 4DVar NAE went operational on the 14th March 2006 after much testing and tuning. We will present results from:- • Two season’s trials (Spring and Summer 2005) • Pre-operational real-time trials – 5 weeks in Dec 2005 • Problems, particularly with screen temperature (T2m) scores. • Future development plans
Spring 2005 Trial 6th – 20th March Mixed conditions: anticyclonic with widespread frost lows bringing gale force winds very mild south-westerlies
Spring 2005 Trial 6th – 20th March The NWP UK index is used to asses skill in the NAE and consists of verification against screen temperature, visibility, wind, cloud amount and precipitation amount. NWP UK Index (NAE area): +1.5% NWP UK Index (UK Mes area): +2.6% NWP UK Index (UK stations): +1.9%
Spring 2005 Trial • Summary • good positive impacts • wind and pressure particularly good • hint of improved balance at T+0 • detriment in screen temperature fit up to T+12
Summer 2005 Trial 18th June – 2nd July Week 1 anticyclonic with thunderstorms Week 2 anticyclonic and more mobile weather with rain over UK
Summer 2005 Trial 18th June – 2nd July NWP UK Index (NAE area): +2.0% NWP UK Index (UK Mes area): +3.7% NWP UK Index (UK stations): +5.4%
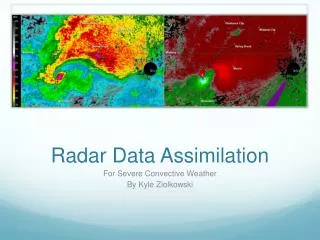
Summer 2005 Trial summer rainfall t+9 3DVAR t+9 4DVAR radar
Summer Trial 2005 • Summary • again good scores, especially ppn • screen level temperature ok after T+0 • better balance in analysis
Real-time trial setup • 4DVAR real-time trial (Dec 2005) final settings • 12km UM /36km PF • Visibility Assimilation on • ‘operational’ 3-hourly 3D-Var control • 6 weeks real-time from Dec 2005 • 4 forecasts per day • 4DVar gave consistently positive results, similar to the seasonal trials
Equitable Threat Score precipitation ETS 3D-Var 4D-Var
Screen Temperature Scores 3D-Var 4D-Var
Screen Temperature investigation • An investigation into the poor initial screen temperature scores, involving experimental reruns in March 2006, was undertaken. • The 1st week of March 2006 included some especially poor screen temperature forecasts.
Single reruns • 18Z on 2nd March was particularly bad so was rerun and compared with experiments including:- • PF Persistence • No Screen Temperature obs • 3DVar • No T2m obs after T+0 (i.e. obs only from T-3 to T+0) • Halving period of all obs (i.e. obs only from T-90m to T+90m)
Screen Temperature VER results • The UM ran to T+6 and RMS’s produced:- • Operational NAE (3DVar 3-hourly) is still better than 4DVar Control at T+0 RMS fit. • PF Persistence has a lower RMS fit than Control 4DVar at T+0 ! • Using T obs only upto T+0 increased RMS. • 3DVar (with 6 hours obs) is similar to 3DVar • Using 3-hours of all obs halves the gap
Issues with Screen Temperature experiments • PF persistence has a lower RMS error to obs at T+0 than 4DVAR. • Removing the 2nd half of the time-window for screen temperature obs increases the RMS error. • Halving the number of all the obs (to between T-90m to T+90m) decreases the T2m RMS but has a major detriment on scores for other variables (especially pressure). • Is the PF model dealing correctly with Surface Temperature? • Stats reflect only one case, but 1-week reruns indicate similar results.
Linearisation tests • In PF-linearisation tests low-level theta in persistence also beats control for the first 2 hours (8 timesteps):- • 4DVar • Persistence • After the first 2 hours the PF model has a higher correlation. Why isn’t this feeding into the analysis?
Damping Coefficient • Theta damping coefficient from analysis increment. • The Theta Damping coefficient is the ratio the average PF model increment size to the average UM increment size • In the lower levels, the Theta PF increment is up to 20% larger than the UM increment • Can we improve the physics to remedy this feature?
Future Improvements • New PF physics package is expected later this year. • Includes better boundary layer mixing and PF convection. • We wait to see how this will influence the screen temperature near T+0.
Recent Improvement • The Screen temperature skill in Summer was improved through soil moisture modifications • We now get soil moisture (outside the UK) from the Global Model nudging scheme replacing climatology
Questions? • Any questions?........