Download
1 / 19
190 likes | 369 Views
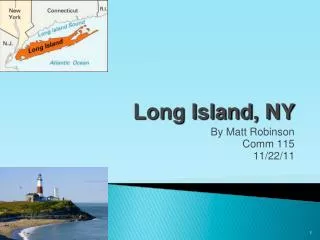
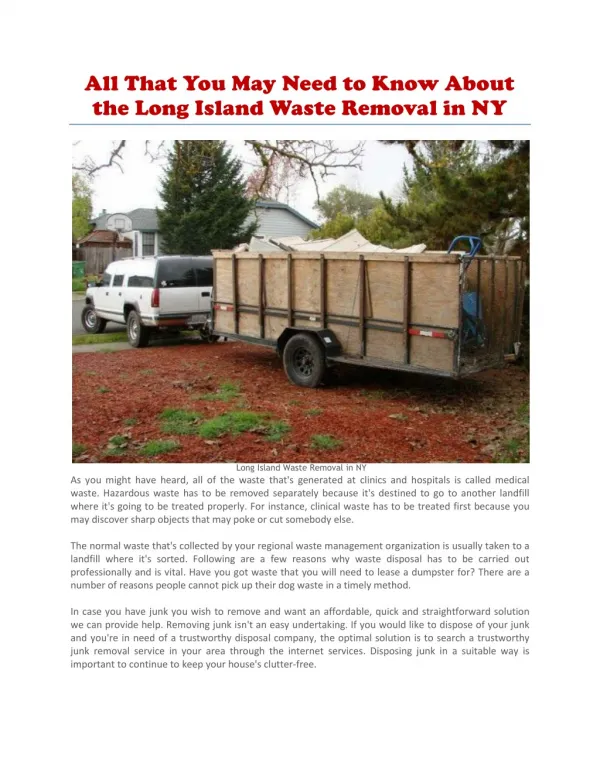
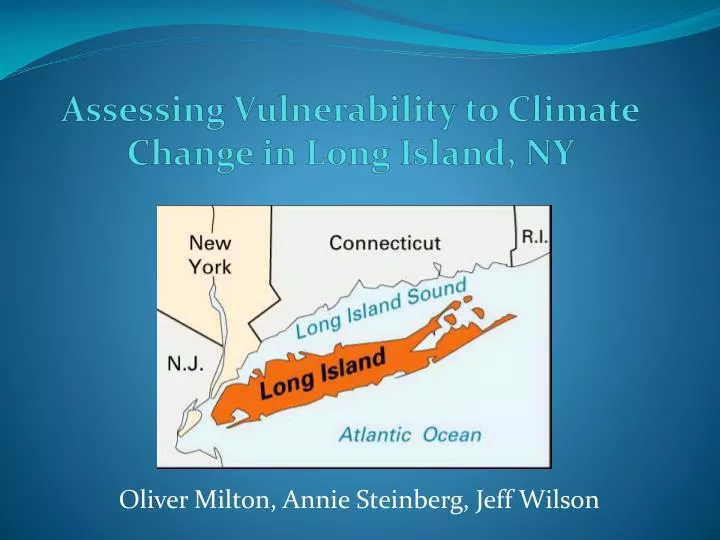
Assessing Vulnerability to Climate Change in Long Island, NY. Oliver Milton, Annie Steinberg, Jeff Wilson. Project Overview. Addressing the challenges of climate change in Long Island –specifically sea level rise Habitat fragmentation Loss of ecosystems Threat to human communities.

E N D
Assessing Vulnerability to Climate Change in Long Island, NY Oliver Milton, Annie Steinberg, Jeff Wilson
Project Overview • Addressing the challenges of climate change in Long Island –specifically sea level rise • Habitat fragmentation • Loss of ecosystems • Threat to human communities
Goal/Purpose • Create a synthesis of methods for characterizing, quantifying, and illustrating community vulnerability to sea level rise in Long Island, NY. • Spatially represent region’s most vulnerable communities • Synthesize method for combining sea level rise data and community vulnerability
Background • Granger, K. 2003. Quantifying storm tide risk in Cairns. Natural Hazards 30: 165-185 • Defining risk
Need to Know Questions • What method (attribute scheme) is best for identifying vulnerable communities in the Long Island area? • Where are the vulnerable communities located on the map? • By what percent are each census blockgroups covered by the 1m sea level rise projection? • Where do vulnerable populations and sea-level rise projections intersect? • Where should coastal managers implement protection techniques using natural green infrastructure?
Methods (NTKQ #1) What method (attribute scheme) is best for identifying vulnerable communities in the Long Island area?
Methods (NTKQ #2) Where are the vulnerable communities located on the map?
Methods (NTKQ #3) By what percent are each census blockgroups covered by the 1m sea level rise projection? • Convert sea-level rise raster data into vector • Clip Census blockgroups with ranks by SLR data • Export attribute table • Join exported attribute table to Census blockgroup layer by STFID • Create new field “pct_cov” • Use field calculator to calculate (Area Covered by SLR)/(Census Block Area) • Outcome is Percent_Covered for each blockgroup
Methods (NTKQ #4) Where do vulnerable populations and sea-level rise projections intersect?
Results Where should coastal managers implement protection techniques using natural green infrastructure?Mastic Beach • (Show google maps, city names where clusters exist)
Results Where should coastal managers implement protection techniques using natural green infrastructure?Saltaireand Fair Harbor
Conclusions • Significant loss of infrastructure and life will occur in Southern Suffolk County without intervention • Many blockgroups of high vulnerability and high risk • Obvious cluster areas • Points for intervention by coastal managers • Require more investigation • Ranking methods work well for identifying areas of most need • GIS is extremely useful in indentifying which areas will need intervention planning
Recommendations • Incorporate weightings • Survey community members/stakeholders • Higher resolution data • Incorporate multiple scenarios • Combine ecosystem vulnerability with social vulnerability