Download
1 / 15
150 likes | 283 Views
Ionospheric Convection during an extended period of Northward IMF. M.F. Marcucci 1 , E. Amata 1 , D. Ambrosino 1 , M.B. Bavassano Cattaneo 1 , I. Bertello 1 , I. Coco 1 , S. Milan 2 , A. Retinò 3 1 Istituto di Fisica delle Spazio Interplanetario – INAF, Rome, Italy

E N D
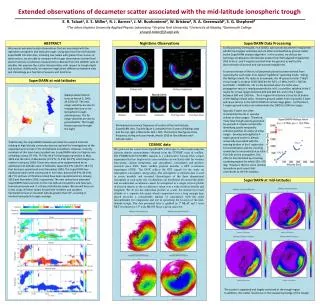
Ionospheric Convection during an extended period of Northward IMF M.F. Marcucci1, E. Amata1, D. Ambrosino1, M.B. Bavassano Cattaneo1, I. Bertello1, I. Coco1, S. Milan2, A. Retinò3 1Istituto di Fisica delle Spazio Interplanetario – INAF, Rome, Italy 2University of Leicester, Leicester, UK 3Swedish Institute of Space Physics, Uppsala, Sweden We present a 3 hour observation period of the ionospheric convection in the Northern hemisphere, made by the SuperDARN radar network during December 3, 2001. The IMF during the time of observations is predominately northward with the By component changing from positive to slightly negative. CLUSTER is skimming the southern high latitude dusk magnetopause and reveals that reconnection is going on quasi-continuously throughout this period with the reconnection site being most of the time tailward of the southern cusp and always near the satellite location. The evolution of the convection pattern, together with the Cluster measurements and IMAGE FUV instrument observations of auroras, are used to infer 1) that double reconnection is occurring poleward of both the Northern and Southern cusps and 2) the relationship between plasma flows and the evolution of two transpolar arc observed in the nightside during this period.
IMF orientation and Dayside Ionospheric Convection Pattern In the figure below are presented: the IMF clock angle measured by Geotail, which is in the solar wind at the dawn flank of the magnetopause; the solar wind dynamic pressure measured by Geotail; the magnetic field clock angle measured by CLUSTER SC3 at high latitude in the southern hemisphere dusk magnetosheath (data are not plotted when the sc is in the magnetosphere); the IMF during the time of observations is predominately northward with the By component being positive in the first part of the interval and slightly negative afterwards, apart from a very short period at 0746 UT. The Geotail and SC3 clock angles show a similar behaviour. The Bx component (not shown) is positive both at SC3 and Geotail. Both Geotail data and SC3 data have been shifted in time by approximately 5 min to account for the reconfiguration time of the ionospheric convection (see discussion below).
The Northern hemisphere coverage of the SuperDARN data during this period is excellent. Each convection map in the interval 0700-1015 UT has been inspected to infer the type of dayside convection around 12 MLT and study its possible dependence on the interplanetary conditions. Typical convection pattern can be observed for extended time periods, identified in the interplanetary conditions figure. To describe the convection we show the SuperDARN average convection maps computed for these periods. In the interval a) a clockwise dawn polar cap cell, is observed simultaneously with a post noon low latitude sunward-dawnward flow; during b) the clockwise dawn polar cap cell is still present but the low latitude flow now is due eastward;during c) a counter-clockwise cell appears together with the clockwise dawn cell;in d) and e) the most prominent feature is the clockwise dawn polar cap cell with the noon flows directed more eastward in d) than in e); in f)a strong weastward and antisunward flow appears on the post-noon region; in g)two symmetric reverse convection cells are observed; in h) the duskward counter-clockwise cell is reduced; in i) and l) the duskward counter-clockwise cell becomes dominating. To summarize: the convection during a) is dominated by a dawnward clockwise cell when the IMF By component is positive for SC3 (and for Geotail for the preceding time, not shown here); the b) and d) pattern are interpreted as the effect of By positive reconnection and correlate with periods of enhanced By positive component, measured by both SC3 and Geotail. The c) and e) pattern are interpreted as due to the IMF rotation from By positive to By negative initiating the formation of the duskward counter-clockwise cell. After 08:35 the convection slowly becomes dominated by a duskward counter clockwise cell when the IMF By component becomes slightly negative. Rapid variations (< 2 min) of the IMF orientation (e.g. about 0756) seem to be not able to permanently reconfigure the high latitude convection.
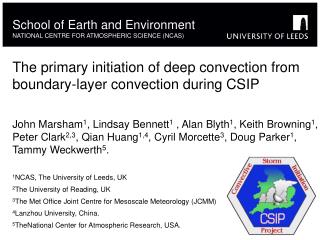
Double Northward IMF Reconnection Looking at the time evolution of the ionospheric convection, if we interpret the presence of polar cap cells and/or twin reversed cells as the effect of lobe reconnection, it appears thatNorthern lobe reconnection is continuously going on. During the period under study Cluster is skimming the southern high latitude dusk magnetopause. Cluster observations during the whole period evidence that reconnection is occurring continuously between lobe field lines and the external magnetic field in the Southern Hemisphere (Retinò et al., 2004), in agreement with the orientation of the IMF. Beside this, detailed study of the three-dimensional distributions function measured by SC3 in the magnetosheath boundary layer revealed that, at specific time intervals, reconnection is occurring simultaneously tailward of the southern cusp and at a northern reconnection site (Bavassano Cattaneo et al., submitted manuscript). In fact, during these intervals, it is possible to identify three populations in the distribution functions: the incident magnetosheath population, the reflected population at the southern (nearest) reconnection site, and the population reflected at a northern reconnection site. Such population is moving down along the magnetosheath magnetic field. It is difficult to ascertain the exact position of this reconnection site, but given the northward orientation of the IMF, it is most probably located tailward of the northern cusp. The most clear events of these type are observed at 093948 - 094012 UT and around 1134 UT. To study the effect of this double reconnection, if any, on the SuperDARN data, we concentrate on the former interval, since during the last event the IMF is rotating and the ionospheric convection is affected by one vortex probably associated with a dynamic pressure variation (not shown here).
If reconnection is going on simultaneously tailward of both cusps we expect that open polar cap flux is transformed in closed dayside flux, therefore we should observe 1) sunward flow crossing the open – closed boundary (OCB) and 2) eventually a poleward motion of this boundary: Newly Closed t=t0 OCB t=t1 t=t2 IMF Newly Opened
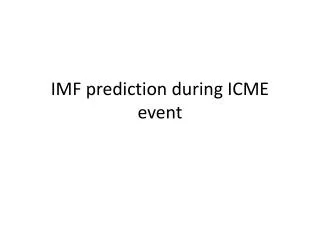
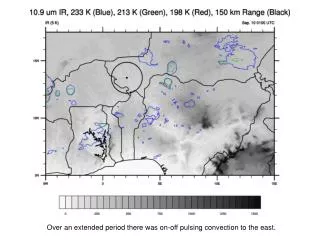
Assuming that the auroral oval gives us an indication of the OCB position, we made the keogram of the IMAGE S13 observations in the interval 14.5 – 15.5 MLT. At this local time, we generally observe the most intense sunward and westward flows for the period after 0820 UT; moreover, it is approximately in the postnoon sector that the footprint of the re-closing magnetic field line should be located according to Cluster observations. To highlight the movement of the maximum auroral luminosity, the latitude of the maximum of the Lorentzian fit of the auroral emission along 15 MLT has been computed for each time and plotted over the keogram. Also the high spectral width region boundary is related to the OCB position. We present the range time plot for the beam 12 of the Hankasalmi radar plotted together with the auroral oval movement. The position of the beam with respect to the 15 MLT meridian is evidenced in the same figure. It is transverse to the 15 MLT meridian but can give an indication of the movement the OCB position. It seems that in the period 0820-1000 UT, 4 poleward movements of the auroral maximum can be identified a’, b’, c’, d’. The duration of the poleward movement ranges approximately from 4 to 10 minutes. Apart from a’, these poleward movement can been observed also on the range time plot. We show the dayside convection maps for the times identified in the plot keogram. The convection maps during the poleward movements of the auroral oval are reported on the right, while convection maps nearby to these intervals are reported on the left. It seems that the poleward movements of the auroral oval are correlated with periods when the velocity perpendicular to the auroral oval is enhanced and the flow seems to cross such boundary. We interpret these observations as the results of lobe flux re-closure at a variable rate.
It must be said that it is necessary to shift in time the LM maximum luminosity by about 2 min to get the agreement with the spectral width boundary movements. We speculate that this could occur because the beam 12 observes the OCB at magnetic local times slightly earlier than 15 MLT, so a possible OCB perturbation is seen first in the keogram measurements and later in the range time plot. We show two auroral image together with two Hankasalmi spectral width field of view plot for a poleward movement and for an equatorward movement which could support this interpretation. 092623 092014
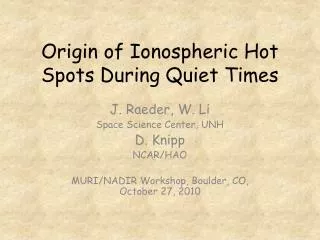
Nightside Transpolar Arcs and Ionospheric Convection A transpolar arc is visible on IMAGE data throughout much of the event (Principal transpolar arc, Ptpa), and a second transpolar arc develops, but not completely, during the time of observations (Secondary transpolar arc, Stpa). Before 0720 no FUV data are available. The IMAGE WIC keogram is reported in the figure. This keogram is composed, for each time of observations, by 8 WIC horizontal slices crossing the midnight meridian approximately every 1° in magnetic latitude in the interval from 74° to 80°. This is necessary because the Ptpa luminosity at 90° magnetic latitude is very weak for most of the time, on the other hand its dynamics at higher latitude is generally related to the motion of the low latitude portion. During the period under study the Ptpa remains stable until 0756 UT, then starts to move duskward. This motion seems to be faster in the interval 0756 – 0820 UT, with respect to the interval 0820 - 0920 UT and is very slow during the interval 0920 - 1018 UT, after which the Ptpa disappears. In the interval 0824 - 0840 UT, the luminosity of the Ptpa is very weak, even if the Ptpa is continuously present. At about 0840 the arc is again well defined ad its luminosity intensifies until 0910 UT. In the figure the movement of the Ptpa has been highlighted with red lines.
In the WIC keogram the Stpa appears only as a fading shape in-between the Ptpa and the duskside auroral oval in the interval 0900 - 1000 UT, since it hardly reaches 75° MLAT even when it is fully developed. In the figure below, the keogram of S13 data with 18 – 06 MLT x 70 – 80 MLAT slices is reported. Here it is evident that the Stpa appears at about 0848 UT, is very weak in the interval 0906 – 0930, and disappears after 1000 UT.
The movements and the luminosity variability of the two transpolar arcs are correlated with the ionospheric plasma convection measured by the SuperDARN data in the nightside. Regarding the Ptpa in the interval 0720 - 0842 UT, below are reported typical convection patterns for the periods a, b, c, identified in the keogram, plotted over the corresponding S13 images. In the first interval convection over the Ptpa is characterized by relatively low velocities; in the interval b velocities over the Ptpa are enhanced and directed weastward, the luminosity of the Ptpa is lower than in the previous interval; in the interval c, the velocities over the Ptpa are lower with respect to the previous period and directed antisunward, the Ptpa’s luminosity is further decreased. a b c
Convection patterns regarding the movements and luminosity variability of both the two arcs after 0840 UT are reported for 8 specific times. Until 0834 UT the convection is similar to the convection reported in panel c. At 0834 UT the antisunward velocity in the dawn night side sector decreases and becomes sunward at 0838 UT: it is at this time that the luminosity of the Ptpa starts to enhance, even if it is not evident from the keogram. In this convection map it seems also that flows change at 70 MLAT around 21 MLT, becoming more antisunward. This situation lasts until 0850, when enhanced weastward flows appear in the nightside. These flows seem to skip the very low latitude part of Ptpa and deflect in proximity of the Stpa. At 0906 UT the antisunward flows observed in proximity of the Stpa disappear, and the weastward velocity seems to increase. This convection pattern remains until 0926 UT, apart for the convection map of 0918 UT, and although the velocity of the weastward jets is reduced at the end. However, note that the low latitude part of the Ptpa is always characterized by very slow flows. At 0926 UT, the antisunward flows at the Stpa end are again evident, and this situation lasts until 0944 UT, apart from the convection map of 0932. At 0944 the antisunward flows, which can be observed near the noon midnight meridian in the night side, seem to be part of the dusk large scale anticlockwise cell that set up at this time. To summarize: 1) the Ptpa luminosity starts to increase in coincidence with the sunward flows period starting at 0838 UT, whereas it has been decreasing during the preceding time of observations, when the flows above the arc remain steadily antisunward or weastward. As already said, the enhanced weastward flows of 0906 - 0918 UT skip the low latitude part of the Ptpa, so that only its high latitude part continues to move weastward, as evident in the WIC keogram in comparison with the S13 keogram at lower latitudes; 2) when sunward flows are observed near the poleward portion of the Stpa, that is during 0850 – 0906 UT and 0926 – 0942 UT, the luminosity of this arc is enhanced, as it can be observed from the S13 keogram (red lines).
Summary and Conclusions • During the period under study the IMF is northward apart for a very short rotation; Cluster observations evidence that reconnection is occurring continuously between lobe field lines and the external magnetic field in the Southern Hemisphere and suggest simultaneous reconnection in the southern and northern hemisphere around 0940 UT. • SuperDARN and IMAGE observations of the Northern Hemisphere polar convection and auroral features provide evidence that: • Lobe reconnection is occuring at the Northern Hemisphere despite the fact that Bx positive and dipole tilt unfavourable, contrary to predictions of Crooker, 1979 and Crooker and Rich, 1993. • Northern lobe reconnection is continuously going on whenever the IMF is northward. • Lobe flux re-closure (Song et al. 1992, Onsager et al., 2001) is occurring at a variable rate as evidenced by poleward movements of the OCB when sunward flows across it are enhanced, confirming Cluster observations. • Moreover a transpolar arc is visible on IMAGE data throughout much of the event and a second transpolar arc develops, but not completely, during the time of observations : • This confirms the results of Cumnock et al. 2005 which noted that theta aurora are almost always formed in the Northern Hemisphere, regardless of Bx positive and dipole tilt unfavourable like in this case.
Besides, 1) the Ptpa moves from dawn to dusk almost steadily from 0750 until approximately 0930 when lobe reconnection transports flux from dusk to dawn. After 0930 UT the convection changes and the dusk cell becomes dominating, and open flux is possibly eroded; 2) during 0838 – 1000 the Stpa moves from dusk to dawn; in the meanwhile the dusk cell develops and flux re-closure occurs. These observations shows how the Ptpa and Stpa movements are dependent on lobe reconnection configuration (Vallarades, 1994; Milan, 2005). • The luminosity enhancements of the two arcs in correspondence with sunward nightside flows are interpreted as localized geomagnetic tail reconnections creating closed flux which intrudes in the night side polar cap. Therefore polar cap flows which are the effect of dayside/lobe reconnection, drives the movements of the polar cap arcs in the interval 0750 - 0930, but sometimes the rate of tail reconnection is such that the polar cap flow are diverted from the presence of the TPAs (e.g 0838 UT). Acknowledgements: IMAGE-FUV images were provided by the FUV team at UC Berkeley. We thank the team members of the GEOTAIL for the magnetic field measurements. This work was supported by the Agenzia Spaziale Italiana and by the Programma Nazionale di Ricerche in Antartide.