Download
1 / 30
300 likes | 473 Views
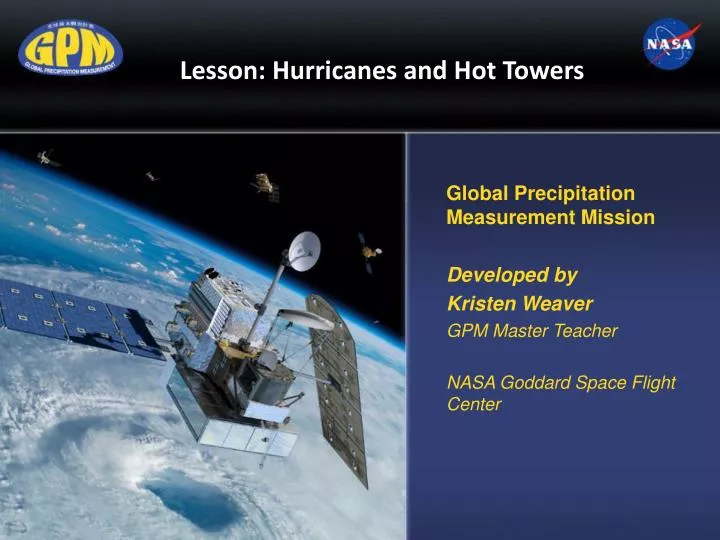
Global Precipitation Measurement Mission Developed by Kristen Weaver GPM Master Teacher NASA Goddard Space Flight Center. Lesson: Hurricanes and Hot Towers. Guiding Questions. Storms: Have you ever experiences a hurricane or a severe storm? What was it like?

E N D
Global Precipitation Measurement Mission Developed by Kristen Weaver GPM Master Teacher NASA Goddard Space Flight Center Lesson: Hurricanes and Hot Towers
Guiding Questions Storms: Have you ever experiences a hurricane or a severe storm? What was it like? Hurricane Damage: What are some of the effects of hurricanes? Hurricane Causes: What conditions cause hurricanes to form? Predicting the Path: How do we predict the path of a hurricane? How have those predictions changed over time, especially with the use of satellites? Using Satellites: How can satellites look inside a hurricane? Predicting the Intensity: What can “hot towers” in a hurricane tell us about its intensity?
Engage • Have you ever experienced a hurricane or a severe storm? What was it like? Images from Microsoft Office ClipArt
Winds and Storm Surge Somerset Point in Pinopolis, SC along the shores of Lake Moultrie during Hurricane Gaston on August 29, 2004 North Roosevelt Boulevard, Key West, Florida during Hurricane Wilma, October 2005 Image courtesy of Mike Stafford, http://www.erh.noaa.gov/chs/pictures.shtml Image source: http://www.srh.noaa.gov/key/?n=wilma
Before and After In the top image, taken in 1998, notice the pier, pier house, and the antebellum house. The bottom image shows the same location on August 31, 2005, two days after Hurricane Katrina made landfall. This photo shows the complete destruction of these landmarks. (Image and text from http://coastal.er.usgs.gov/hurricanes/katrina/photo-comparisons/mainmississippi.html)
Effects of a Hurricane 9th Ward flooding caused by Hurricane Katrina Damage caused by Hurricane Katrina Images from: http://sos.noaa.gov/Education/forecast.html
Three Factors of Hurricane Formation What do hurricanes need to be able form? • Warm water (at least 80°) • Moist Air • Converging Winds Image source: http://scijinks.jpl.nasa.gov/hurricane
Where do hurricanes form? The storms get what they need from the warm equatorial waters off the coast of Africa, and then blow west toward the U.S. coast.
Hurricane Damage Because hurricanes can be so damaging, we want to be able to predict when and where they will hit land and how strong they might be, to help people prepare. Storm surge from Hurricane Ike Damage caused by Hurricane Gustav Image source: http://sos.noaa.gov/Education/forecast.html
Prediction the Path of a Hurricane We especially need to know the path of the hurricane to warn people who might be affected. Click the image to go to a website showing any current hurricane warnings. Tropical Storm Force Wind Speed probabilities, 120 hour, for Hurricane Katrina issued 5 PM Wednesday, August 24, 2005/NOAA
Track Forecast Cones A track forecast cone represents the probable track of a tropical cyclone (called a hurricane when they form in the Atlantic Ocean). These are changed as scientists get new data about the storm, because they want to be as accurate as possible. Click the image to go an animation of the progression of forecast cones for the storm.
Historical Predictions Back in the old days, hurricane predictions were based entirely on ground observations. Before radio, telephones, and the Internet, imagine how hard it would be to share information, and warn people they might be in danger! The great Galveston hurricane (in 1900) roared through the prosperous island city with winds in excess of 130 miles per hour and a 15-foot storm surge. When it was finally over, at least 3,500 homes and buildings were destroyed and more than 8,000 people were killed. Image and caption source: http://celebrating200years.noaa.gov/magazine/galv_hurricane/Galveston19001.html
Developments in Prediction Technology Later, ships at sea were able to transmit information to shore via radio, and we developed radar and hurricane hunter aircraft (as in NASA’s HS3 mission) to give us more data to put into computer models to help with predictions. Click on either image to go to a short video about NOAA’s advances in radar.. Click the image to go to an animation of the aircraft scanning a storm to monitor the formation of the eyewall.
Modern Predictions Even better, these days we have satellites that can watch the storm the entire time its active, greatly improving our ability to predict the path of a hurricane. Hurricane Bonnie, August 1998: 5-Day Forecasts vs. Actual Storm Track. Improved forecasts can save money ($600K to $1M per mile of coast evacuated) and lives by more precisely predicting where the hurricane eye will be located at landfall. Source. Dr. A. Hou, NASA DAO Click the image to go to a video about forecasting hurricanes.
Satellite Views of Hurricanes Satellites can show us the storm clouds as they move across the ocean, such as in this animation of Hurricane Katrina But what if we want to see more, such as how much rain is falling, or what is happening inside the storm? Satellites can help us with that, too.
Tracking Precipitation from Space • Satellites can provide a more complete picture of rain from space, allowing scientists to look at storms, rainfall totals, and changes throughout days to years • The Tropical Rainfall Measuring Mission (TRMM) has been providing rainfall data since 1998 in the tropics and mid latitudes • The Global Precipitation Measurement (GPM) Mission will extend observations of rain and snow up to the Arctic and Antarctic Circles
Instruments on TRMM - Microwave NASA scientists are using the TRMM satellite to understand which parts of a hurricane produce rainfall and why, like this microwave image of a hurricane. The red and yellow indicate areas of heavier rainfall compared to the blue and green. This is especially useful over oceans, where we don’t have rain gauges.
Instruments on TRMM - Radar Using radar, TRMM can even see inside a storm! Revealing the 3-D structure of the hurricane can tell us a lot about what will happen next with the storm. Hurricane Sandy on Oct. 28, two days prior to landfall Click the image to go to an animation of the data.
Instruments on TRMM The upper image shows the same 3-D view into Hurricane Sandy (using radar) as the previous slide. The lower image is microwave data showing rainfall totals, also for Sandy. The more data we have to work with, the better chance we have of making good predictions!
Hot Towers Looking at what are called “hot towers” using radar has helped scientists develop insight into what causes hurricanes to intensify – the towers often occur before a storm gets stronger. Pretty important if you’re in the path of one! TRMM Observations of Hurricane Bonnie (1998)
Share what you’ve learned! Now that you know the basics about what causes a hurricane and how and why we try to predict them, create a news report or weather forecast (performed with a script or created as a comic strip), telling people about a hurricane that’s coming and how we know where it will hit and if it will intensify. Images from Microsoft Office ClipArt
News Report or Comic Strip Some ideas to consider including: • How is hurricane forecasting different now than it used to be? • Imagine being a weather forecaster in two different areas of the coast, one in the direct path of the hurricane and one only near it. What would be different about what you tell people about the storm? • How does our knowledge of a storm change as it gets closer? How might that change what you need to tell people? • Optional: How should people prepare for a hurricane?
Extension Activities Extension Activities
Stay Connected! • Follow us on Twitter: @NASA_Rain • “Like” us on Facebook: www.facebook.com/NASA.Rain • Precipitation Education Website: pmm.nasa.gov/education