Download
1 / 29
290 likes | 485 Views
Development of Hurricane Rita Evacuation Trip Tables for the Houston-Galveston Region. Jim D. Benson, Texas Transportation Institute Chris Van Slyke, Houston-Galveston Area Council Alan C. Clark, Houston-Galveston Area Council. Today’s Presentation. Dimensioning The Problem

E N D
Development of Hurricane Rita Evacuation Trip Tables for the Houston-Galveston Region Jim D. Benson, Texas Transportation Institute Chris Van Slyke, Houston-Galveston Area Council Alan C. Clark, Houston-Galveston Area Council TRB Planning Applications Conference
Today’s Presentation • Dimensioning The Problem • Study Area And Data Base • Trip Generation Models • Trip Distribution Models • Time-of-day Factors • Developing Alternative Scenarios TRB Planning Applications Conference
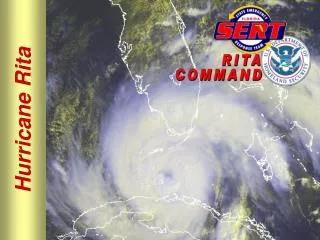
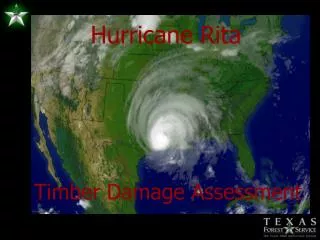
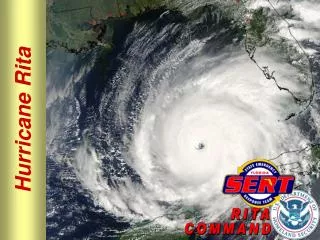
Hurricane Rita – Sept 2005 TRB Planning Applications Conference
Evacuation Zones TRB Planning Applications Conference
Example Evacuation Speeds Morning 9/22 TRB Planning Applications Conference
H-GAC Study Area TRB Planning Applications Conference
Houston TranStar Rita Evacuation Survey • Solicited participation on website • Participants responded to questions online • 6,570 respondents • 6,286 usable household responses • 3,886 households evacuated by car or truck TRB Planning Applications Conference
Evacuation Generation Models • Models developed for Rita event • Structured to facilitate exploring different evacuation scenarios TRB Planning Applications Conference
APPROACH • Six-day event modeled • Cross-classification variables: • 6 geographical districts • 5 household size groups • Production models: • Probability of evacuating • Vehicle trips/evacuation household • Trip purpose split • Simple attraction models • Non-resident trip models TRB Planning Applications Conference
Six Districts TRB Planning Applications Conference
Internal Evacuation Attractions TRB Planning Applications Conference
External Station Evacuation Attractions • Distributed attractions to other urban areas based on their population and relative accessibility • Allocated results to external stations TRB Planning Applications Conference
Rita Evacuation Generation Results TRB Planning Applications Conference
Two Trip Distribution Models • Evacuation trips to internal zones • Evacuation trips to external stations TRB Planning Applications Conference
Distribution Model For Internal Attractions • Essentially a “constrained interactance” model • No friction factors • No iterative process • Constrained to productions • Interaction constraint • Productions allocated to eligible attraction zones based on relative attractiveness TRB Planning Applications Conference
Interaction Constraint • No attractions to zones in the 3 mandatory evacuation areas • Eligible attraction zones must be either: • Further from the coast, OR • 80+ miles from the coast TRB Planning Applications Conference
Distribution Model For External Station Attractions • Similar to traditional external-local models • Primary difference: external stations are treated the attractions • Somewhat relaxed version of the normal external-local friction factors used TRB Planning Applications Conference
TRIP DISTRIBUTION RESULTS TRB Planning Applications Conference
Time-of-day Factors • Estimated from survey data • Developed for each of the six districts • Hourly Distribution for 6-day Event TRB Planning Applications Conference
Developing Alternative Scenarios • Consider adjustments to % households evacuating by district • Consider adjusting hourly distributions by district • Consider adjusting vehicle trip rates to reflect taking fewer vehicles by district TRB Planning Applications Conference
Questions? TRB Planning Applications Conference