Download
1 / 29
290 likes | 405 Views
Social Discount Rate Travel Costs. Scott Matthews Courses: 12-706 and 73-359 Lecture 14 - 10/15/2003. Admin Issues. Early Course Evals HW #2 Overview, results (mean=42) Optional Friday recitations/project review sessions Scheduling of Project Presentations. Social Discount Rate.

E N D
Social Discount RateTravel Costs Scott Matthews Courses: 12-706 and 73-359 Lecture 14 - 10/15/2003
Admin Issues • Early Course Evals • HW #2 Overview, results (mean=42) • Optional Friday recitations/project review sessions • Scheduling of Project Presentations 12-706 and 73-359
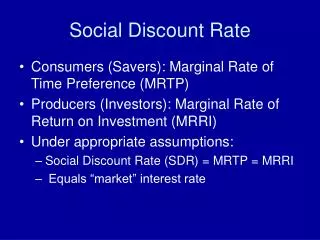
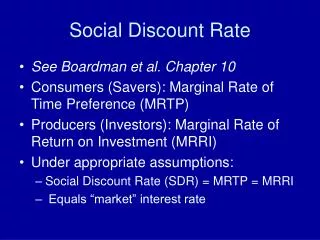
Social Discount Rate • Discounting rooted in consumer preference • We tend to prefer current, rather than future, consumption • Marginal rate of time preference (MRTP) • Face opportunity cost (of foregone interest) when we spend not save • Marginal rate of investment return 12-706 and 73-359
Intergenerational effects • We have tended to discuss only short term investment analyses (e.g. 5 yrs) • What about effects in distant future? • Called intergenerational effects • Economists agree that discounting should be done for public projects • Do not agree on positive discount rate 12-706 and 73-359
An example • Someone offers you choice of $1000 now and $1200 in one year • If you have no preference (indifferent) then your MRTP is 20% 12-706 and 73-359
Discounting handout • How much do/should we care about people born after we die? • Higher the discount rate, the less future values will count compared to today • Ethically, no one’s interests should count more than another’s • Implies there is no justification for discounting across long time periods • Called ‘equal standing’ 12-706 and 73-359
Climate Change • Discussions ongoing about how best to manage global CO2 emissions to limit effects of global change • Should we sacrifice short-run economic growth to do something to improve environment and leave resources for the future? • Really asking 2 separate questions! 12-706 and 73-359
Two Questions • What duty do we have to make sacrifices for future generations? • If we sacrifice, what is the optimal policy to maximize benefit? • So we should compare global change proposals with alternatives • Perhaps higher R&D spending on science or medicing would have higher benefits! 12-706 and 73-359
Hume’s Law • Thus discounting issues are normative vs. positive battles • Hume noted that facts alone cannot tell us what we should do • Any recommendation embodies ethics and judgment • E.g. focusing on ‘highest NPV’ implies net benefits is only goal for society 12-706 and 73-359
Some evidence • Cropper et al surveyed 3000 homes • Asked about saving lives in the future • Found a 4% discount rate for lives 100 years per now • Equal standing does not imply different generations have equal claims to present resources! • Harsanyi says only do so if their marginal gain is higher than our loss 12-706 and 73-359
More evidence • If future generations will be better off than us anyway • Then we might have no reason to make additional sacrifices • There might be ‘special standing’ in addition to ‘equal standing’ • Immediate relatives vs. distant relatives • Different discount rates over time • Why do we care so much about future and ignore some present needs (poverty) 12-706 and 73-359
Travel Costs • Time is a valuable commodity (time is $) • Most major transportation/infrastructure projects built to ‘save travel costs’ • Need to tradeoff project costs with benefits • Ex: new highway that shortens commutes • Differences between ‘travel’ and ‘waiting’ • Waiting time disutility might be orders of magnitude higher than just ‘travel disutility’ • Why? Travelling itself might be fun 12-706 and 73-359
Valuation: Travel Cost Method • Estimate economic use values associated with ecosystems or sites that are used for recreation • changes in access costs for a recreational site • elimination of an existing recreational site • addition of a new recreational site • changes in environmental quality • www.ecosystemvaluation.org/travel_costs.htm 12-706 and 73-359
Travel Cost Method • Basic premise - time and travel cost expenses incurred to visit a site represent the “price” of access to the site. • Thus, peoples’ WTP to visit the site can be estimated based on the number of trips that they make at different travel costs. • This is analogous to estimating peoples’ WTP for a marketed good based on the quantity demanded at different prices. 12-706 and 73-359
Example Case • A site used mainly for recreational fishing is threatened by development. • Pollution and other impacts from this development could destroy the fish habitat • Resulting in a serious decline in, or total loss of, the site’s ability to provide recreational fishing services. • Resource agency staff want to determine the value of programs or actions to protect fish habitat at the site. 12-706 and 73-359
Why Use Travel Cost? • Site is primarily valuable to people as a recreational site. There are no endangered species or other highly unique qualities that would make non-use values for the site significant. • The expenditures for projects to protect the site are relatively low. Thus, using a relatively inexpensive method like travel cost makes the most sense. • Relatively simple compared to other methods 12-706 and 73-359
Options for Method • A simple zonal travel cost approach, using mostly secondary data, with some simple data collected from visitors. • An individual travel cost approach, using a more detailed survey of visitors. • A random utility approach using survey and other data, and more complicated statistical techniques. 12-706 and 73-359
Zonal Method • Simplest approach, estimates a value for recreational services of the site as a whole. • Collect info. on number of visits to site from different distances. Calculate number of visits “purchased” at different “prices.” • Used to construct demand function for site, estimate consumer surplus for recreational services of the site. 12-706 and 73-359
Zonal Method Steps • 1. define set of zones around site. May be defined by concentric circles around the site, or by geographic divisions, such as metropolitan areas or counties surrounding the site • 2. collect info. on number of visitors from each zone, and the number of visits made in the last year. • 3. calculate the visitation rates per 1000 population in each zone. This is simply the total visits per year from the zone, divided by the zone’s population in thousands. 12-706 and 73-359
Sample Data 12-706 and 73-359
Estimating Costs • 4. calculate average round-trip travel distance and travel time to site for each zone. Assume Zone 0 has zero travel distance and time. Use average cost per mile and per hour of travel time, to calculate travel cost per trip. Standard cost per mile is $0.30. The cost of time is from average hourly wage. Assume that it is $9/hour, or $0.15/minute, for all zones, although in practice it is likely to differ by zone. 12-706 and 73-359
Data 5. Use regression to find relationship between visits and travel costs, e.g. Visits/1000 = 330 – 7.755*(Travel Cost) 12-706 and 73-359
Final steps • 6. construct demand for visits with regression. First point on demand curve is total visitors to site at current costs (with no entry fee), which is 1600 visits. Other points by estimating number of visitors with different hypothetical entrance fees (assuming that an entrance fee is valued same as travel costs). Start with $10 entrance fee. Plugging this into the estimated regression equation, V = 330 – 7.755C: 12-706 and 73-359
Demand curve • This gives the second point on the demand curve—954 visits at an entry fee of $10. In the same way, the number of visits for increasing entry fees can be calculated: 12-706 and 73-359
Graph Consumer surplus = area under demand curve = benefits from recreational uses of site around $23,000 per year, or around $14.38 per visit ($23,000/1,600). Agency’s objective was to decide feasibility to spend money to protect this site. If actions cost less than $23,000 per year, the cost will be less than the benefits provided by the site. 12-706 and 73-359
Value - travel time savings • Many studies seek to estimate VTTS • Can then be used easily in CBAs • Book reminds us of Waters 1993 (56 studies) • Many different methods used in studies • Route, speed, mode, location choices • Mean value of 48% of wage rate (median 40) • North America: 59%/42% • Miller (1989): 60% drivers, 40% passengers • 90% drivers/60% passengers in congested areas 12-706 and 73-359
Monetary studies • NCHRP 2-18 (1995): National Cooperative Highway Research Program • Stated preference survey method • $15,000 income => $2.64/hour VTTS • $55,000 @ $5.34/hour • $95,000 @ $8.05/hour (decreasing) 12-706 and 73-359
Government Analyses • Again, travel versus leisure important • Wide variation: 1:1 to 5:1! • Income levels are important themselves • VTTS not purely proportional to income • Waters suggests ‘square root’ relation • E.g. if income increases factor 4, VTTS by 2 • Typically 40-60% of hourly rate in CBAs • US DOT: 50% of wage rate - local travel • 70% of wage for intercity personal travel • 100% of wage (plus fringe) - intercity business travel 12-706 and 73-359
Recreation Benefits • Value of recreation studies • ‘Values per trip’ -> ‘value per activity day’ • Activity day results (Sorg and Loomis 84) • Sport fishing: $25-$100, hunting $20-$130 • Camping $5-$25, Skiing $25, Boating $6-$40 • Wilderness recreation $13-$75 • Are there issues behind these results? 12-706 and 73-359