Download
1 / 17

E N D
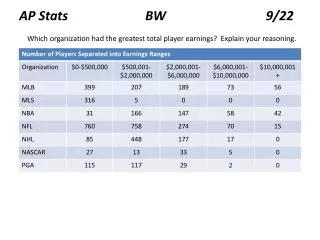
AP STATS B/W 8/20 • Researchers studied the effects that improving vision with eyeglasses had on educational outcomes. They identified 2,069 students who could improve their vision with eyeglasses. 750 were not offered eyeglasses and 1,319 were. Of the 1,319 offered eyeglasses, 928 accepted the eyeglasses. Students who received the eyeglasses scored significantly higher in both math and science. What was the treatment in this study? • Being offered eyeglasses • Not receiving eyeglasses • Scoring significantly higher in math • Receiving eyeglasses • Being identified as a student who could improve vision
Identify proper sampling techniques and identify biased samples by analyzing real-world experimental designs. Section1.3 – Experimental DesignPart 2 – Bias and Sampling Techniques SWBAT:
Biased Sample: • A sample that is NOT representative of the population. • Results in averages that may be too low/too high compared to population parameter. • EX: Ask students in a college math class if they like math. IDENTIFY BIAS
1) NON-RESPONSE BIAS: • When responses are NOT OBTAINED FROM ALL PEOPLE selected in the sample • EX: -Mailing out surveys and some don’t respond. • -1000 calls are made but 600 don’t answer / hang up • Why is NON-RESPONSE BIAS a problem? • -the original sample size was selected so that it is representative of the entire population; by not getting all the sample, we are reducing representativeness • What can we do to reduce NON-RESPONSE BIAS? • -increase sample size to account for expected non-responses • -randomize our TIMES of collecting data • -use multiple contact methods (ie email AND follow up calls) • -use a difference type of data collection method TYPES OF BIAS
2) RESPONSE BIAS: • When responses DO NOT REFLECT THE TRUE FEELINGS of the respondent • AKA – Measurement Bias • Several Causes of Response Bias: • a. Interviewer error d. Ordering of questions • b. Misrepresented answers e. Type of questions • c. Wording of Questions f. Data-entry Errors • EX: -Why are drivers who change lanes several times dangerous? • vs Does changing lanes several times have an impact on driving safety? • Why is RESPONSE BIAS a problem? • -NOT getting true results • What can we do to reduce NON-RESPONSE BIAS? • -Train interviewers • -Reword / reorder questions • -Consider the types of questions TYPES OF BIAS, CONT’D
3) SELECTION BIAS: • A part of the population is systematically EXCLUDED from the survey • AKA – Undercoverage Bias • Sources of bias resulting from METHOD OF SELECTING THE SAMPLE: • Letting someone VOLUNTEER to be in the sample • Using a sampling method just because it is CONVENIENT • Selecting the sample by using “EXPERT” judgment (NOT random) • Constructing an inadequate sampling frame • Sample size (not large enough) TYPES OF BIAS, CONT’D
Bad Sampling Methods Commonly Used: • Voluntary Response Sample: • Consists of people who CHOOSE THEMSELVES by responding to GENERAL APPEAL • EX: -Call in radio shows solicit audience participation. • -Surveys that pop up on your computer! • Why are these biased? • -responses are typically from people with strong/extreme opinions • -results often overstated • Convenience Sample: • Sample selected by taking the members of the population who are EASIEST to reach • EX: -A pollster interviews people at a local mall. • -Interviewing just seniors in class about where to hold senior prom. • Why are these biased? • -not representative • -not random Selection Bias, cont’d
Determine the type of bias present in the following examples. Justify your response and provide an alternative method/statement. A local newspaper ran a survey by asking, “Do you support the development of a weapon that could kill millions of innocent people?” This is response bias because the wording of the question tends to encourage negative responses. Alternative: What is your level of support for developing military weapons. 1, 2, 3, 4, 5, 6, 7, 8, 9, 10 (10 being 100% support) Using a local telephone book to select a simple random sample. This is selection bias because not all people have phone or choose to put phone numbers in the telephone book. Alternative: Use a Postal Service address list to select? You Try….
To collect as unbiased data as possible, a researcher must ensure that the sample is representative of the population…. You need a RANDOM sample: A random sample is when EVERY MEMBER OF THE POPULATION has an EQUAL CHANCE OF BEING SELECTED There are several ways to choose a sample using randomization. Let’s look at some of the most common…. Sampling Techniques
1.) Simple Random Sample (SRS): Assign a different # to each member and use a random # generator to select those to be included in the sample. EX: Suppose there are 132 students currently enrolled in dance class at NPA. You wish to form a sample of eight students to answer some survey questions. Select the students who will belong to the simple random sample. Random Number Table (Appendix B) -Randomly pick a column and line number to start the selection process -Read digits in groups based on the digits for the highest number in your sample (132 is a 3-digit # so groups of 3). If there were 1000 subjects, then groups of 4). -Ignore/cross out #s greater than 132. -Repeat until you get the sample size predetermined in the problem. Graphing Calculator MATH PRB randInt( starting # , ending # , sample size ) Random Sampling Techniques
2.) Stratisfied Sample: • Use this when it is important to have members from each SEGMENT of a population • Divide the population into subgroups (strata) that share similar characteristics such as age, gender, ethnicity, geography, etc. • From each stratum, obtain a simple random sample (SRS) • EX: To collect a stratified sample of the number of people who live in West Ridge County households, you could divide the households into socioeconomic levels, and then randomly select households from each level • Group 1: Low income Group 2: Middle income Group 3: High income • X XXXXXXXXXXXXXXXX Random Sampling Techniques, cont’d
3.) Cluster Sample: • Use this when the population falls into naturally occurring subgroups, each having similar characteristics • Divide the population into groups (clusters) • Obtain an SRS of the clusters • Use ALL the members of clusters chosen • EX: Zip code Zones in West Ridge County • ZONE 1 ZONE 2 ZONE 3 ZONE 4 ZONE 5 Zone 6 Zone 7 ZONE 8 • XXXXXX XXXXXXX XXXXXX XXXXXX XXX XXXXX XXXXXX XXX Random Sampling Techniques, cont’d
4.) Systematic Sample Each member of the population is assigned a number, then we choose every nth individual in a population EX: Every 3rd member of 1-100 people is chosen. This is advantageous as it is an easy method to use. HOWEVER…. This method should be avoided if there are regularly occurring patterns in the data Random Sampling Techniques, cont’d
You are doing a study to determine the opinion of students at your school regarding stem cell research. Identify the sampling technique you are using if you select the samples listed. You select a class at random and question each student in the class. Cluster sample You divide the student population with respect to majors and randomly select and question some students in each major. Stratefied sample 3. You assign each student a number and generate random numbers. You then question each student whose number is randomly selected. Simple random sample 3. You assign each student a number and, after choosing a starting number, question every 25th student. Systematic sample Examples….
Identify the sampling technique used (random, cluster, stratified, convenience, systematic). 32 sophomores, 35 juniors, and 49 seniors are randomly selected from 230 sophomores, 280 juniors, 577 seniors at a certain high school. To ensure customer satisfaction, every 35th phone call received by customer service will be monitored. 3. A journalist goes to a campground to ask people how they felt about air pollution. 4. Calling randomly generated telephone numbers, a study asked 855 US adults which medical conditions could be prevented by their diet. 5. A pregnancy study in Chicago, randomly selected 25 communities from the metropolitan area, then interviewed all pregnant women in these communities. Exit Ticket….
Identify the sampling technique used (random, cluster, stratified, convenience, systematic). 32 sophomores, 35 juniors, and 49 seniors are randomly selected from 230 sophomores, 280 juniors, 577 seniors at a certain high school. Stratified sample To ensure customer satisfaction, every 35th phone call received by customer service will be monitored. Systematic sample 3. A journalist goes to a campground to ask people how they felt about air pollution. Convenience sample 4. Calling randomly generated telephone numbers, a study asked 855 US adults which medical conditions could be prevented by their diet. Random sample 5. A pregnancy study in Chicago, randomly selected 25 communities from the metropolitan area, then interviewed all pregnant women in these communities. Cluster sample Exit Ticket….