Download
1 / 38
380 likes | 531 Views
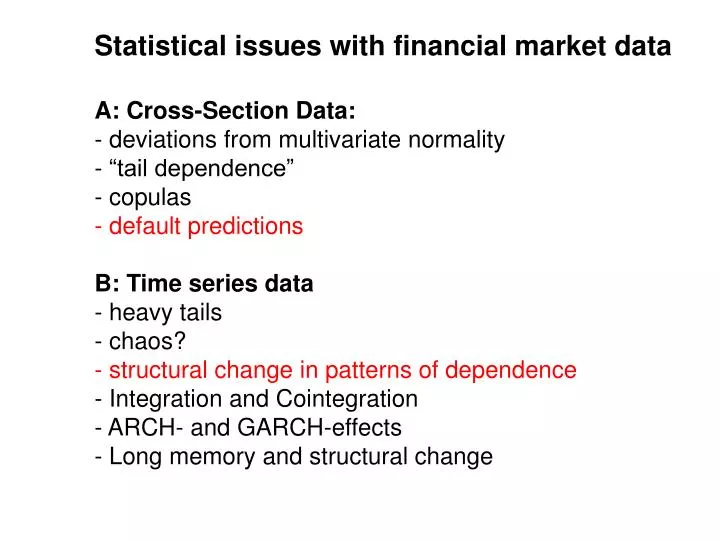
Statistical issues with financial market data A: Cross-Section Data: - deviations from multivariate normality - “tail dependence” - copulas - default predictions B: Time series data - heavy tails - chaos? - structural change in patterns of dependence - Integration and Cointegration

E N D
Statistical issues with financial market data A: Cross-Section Data: - deviations from multivariate normality - “tail dependence” - copulas - default predictions B: Time series data - heavy tails - chaos? - structural change in patterns of dependence- Integration and Cointegration - ARCH- and GARCH-effects - Long memory and structural change
Correspondence between selected S+P-grades and default probabilities • (from M. Carey: “Some evidence on the consistency of banks’ internal credit ratings,” Federal Reserve Board 2001, Table 1, page 7 )
Rated A by S+P, Sept. 9, 2008 Default, Sep. 15, 2008
Filed for bancruptcy Dec. 1. 2001Was rated investment status byboth Moody‘s and S+P 1 month before Formerly Worldcom; defaults on credit payments in July 2002, rated A by S+P In April 2002. Formerly the world's biggest dairy productproducer, had its credit rating cut to junkafter missing a payment in Dec. 2003;rated A a couple of months before
Evaluating and comparing probability forecasters (=rating agencies) Case 1:Raters A and B rate different obligors at different points in time (“skill scores”) Case 2:Raters A and B rate identical obligors at identical points in time
Credit ratingsRated the same by Moody’ and S&P Sources: Moody’s; Federal Reserve Bank of New York
Default ordering(S. Vardemann and G. Meeden, Journal of the American Statistical Society 1983): A is better than B if its cumulated percentage of defaults (with cumulation starting in the good grades) is nowhere above that of B‘s. Likewise for non-defaults
Theorem1 (Vardeman/Meeden 1983): If A and B are both well calibrated, and A dominates B in the default ordering, then A is more refined than B.
Theorem 2 (Krämer 2005): Let A and B be both well calibrated. Then A and B cannot be ordered according to the Vardeman/Meeden default ordering.
Theorem (independently by various authors): Consider all possible pairs of defaults and non-defaults. The accuracy ratio (=area underneath the ROC-curve) is then equal to the probability that in one such randomly chosen pair, the non-default is ranked higher than the default
Theorem: Let A and B be (semi-)calibrated probability forecasters. Then we have: The converse does not hold
California Edison: rated A+ in 1999,default 2001 (has recovered in the meantime)
W. Krämer:Strukturbruchtests bei Renditekorrelationen Gemeinsame Arbeiten mit Maarten van Kampen Jonas Kaiser Dominik Wied
Modellierung zeitvariabler Abhängigkeiten • Dynamische bedingte Korrelationen:R. Engle: „Dynamic conditional correlation: A simple class of multivariate generalized autoregressive conditional heteroskedasticity models,“ Journal of Business and Economic Statistics 20, 2002, 339-350. • „Markov-Switching“:D. Pelletier: „Regime switching for dynamic correlations,“ Journal of Econometrics, 2006, 445-473M. Haas: „Covariance forecasts and long-run correlations in a Markov-switching model for dynamic correlations“, Finance Research Letters, 7, 2010, 86-97 • Dynamische Copulas:A. Patton: „Modelling asymmetric exchange rate dependence,“ International Economic Review 47, 2006, 527-556.D. Totouom: Dynamic Copulas: Applications to finance and economics, Paris 2007.E. Giacomini, W. Härdle, und V. Spokoiny: „Inhomogeneous dependency modelling with time varying copulae,“ Journal of Business and Economic Statistics 27, 2009, 224-234.D. Guegan und J. Zhang: Change analysis of a dynamic copula for measuring dependende in multivariate data,“ Quantitative Finance 10, 2010, 421-430.
Was ist eine Copula? Ausgangspunkt ist folgendes ebenso zentrale wie elementare Resultat der W-Theorie: Sei X stetige Zve mit Verteilungsfunktion F. Dann ist die neue Zve U:= F(X) auf [0,1] gleichverteilt Def: die gemeinsame Verteilung von U=F(X) und V=G(Y) heißt Copula von von X und Y Satz: Die gemeinsame Verteilung von X und Y ist durch die Copula und die beiden Randverteilungen eindeutig festgelegt ,
Randabhängigkeit („tail dependence“):Links: 3000 tägliche BMW- und VW-Renditen,Rechts: 3000 bivariat normalverteilte Zufallsvektoren = ?
Ausgewählte Literatur zu Randabhängigkeiten Longin/Solnik: „Extreme Correlation of international equity markets,“ Journal of Finance 2001 R. Schmidt: „Tail dependence for elliptically contoured distributions,“ Math. Meth. Oper. Research 2002 Falk/Michel: „Testing for tail dependence in extrem value models,“ AISM 2006 Hüsler/Li: „Testing asymptotic independence in bivariate extremes,“ Journal of Statistical Planning and Inference 2009 F.Schmid/R.Schmidt/ J.Penzer: „Measuring Large Comovements in Financial Markets“, erscheint in Quantitative Finance 2010. Bücher/Dette/Volgushev: „A new estimator of the Pickands dependence function and a test for extrem-value correlation,“ Dortmund 2010 (SFB 823 Diskussionspapier).
Signifikanztests auf konstante Abhängigkeitsstruktur A): endogene Brüche: mögliche Muster unter der Alternative sind dateninduziert („truncated correlations“, „excess correlations“) B): exogene Brüche: Aufspaltung der Stichprobe nach potentiell unterschiedlichen Abhängigkeitsmustern ohne Ansicht der realisierten Werte von (X, Y)
bedingte Korrelation von X und Y, gegeben X A Bei bivariater Normalverteilung gilt (Boyer et al. (1999) „Pitfalls in tests for changes in correlations“, International Finance Discussion Papers Number 597):
Theorem: E(XZ|X A) = 0
Gemeinsame Verteilung konstant? Copula konstant?Dias/Embrechts 2004Remaillard/Scaillet 2009 Zweite Momente konstant?Bartlett 1949 Aue et al. 2009 Copula constantin einem Punkt?Harvey/Busetti 2009Krämer/v.Kampen 2010 Spearman ρ,Kendall τ konstant?Dobric/FrahmSchmid 2007Schmid/Gaisser 2010 Varianzenkonstant?Riesige Literatur Korrelationenkonstant?Kullback 1967Jennrich 1970Fischer 2007Wied 2009Wied/Krämer/Dehling 2010
Grundidee (Busetti & Harvey 2009): Betrachte empirischeCopula C*(τ, τ) und 1 (sowohl Xt wie Yt links vom IT,t(τ, τ) := empirischen τ-Quantil0 sonst Unter H0:
Grundidee: Lehne Ho ab bei extremer Fluktuation von Emp. Korrelation unter Nutzung aller Datenpunke = Approximation für wahres ρ empirische Korrelation der Datenpaare 2, …, t
Für Details siehe: J. Kaiser, W. Krämer (2010): “A cautionary note on computing conditional from unconditional correlations”. Erscheint in Economics Letters. W. Krämer, M. van Kampen (2010): „A simple nonparametric test for structural change in joint tail probabilities“, Erscheint in Economics Letters). Dominik Wied: „A generalized functional delta method,“ Dortmund 2010 (SFB 823 Diskussionspapier). D. Wied, W. Krämer, H. Dehling. "Testing for a change in correlation at an unknown point in time", 2010, zur Veröffentlichung eingereicht. M. van Kampen, D. Wied. "A nonparametric constancy test for copulas under mixing conditions", Dortmund 2010 (SFB 823 Diskussionspapier). M. Arnold, N. Bissantz, D. Wied, D. Ziggel. "A new online-test for changes in correlations between assets", Dortmund 2010 (SFB 823 Diskussionspapier).
Verallgemeinerungen auf höhere Dimensionen Copula-Based Measures of Multivariate Association (with T. Blumentritt, S. Gaißer, M. Ruppert, R. Schmidt),In: F. Durante, W. Härdle, P. Jaworski, T. Rychlik (eds.) Workshop on Copula Theory and its Applications. Springer, 2010. Nonparametric inference on multivariate versions of Blomqvist's beta and related measures of tail-dependence (with R. Schmidt), Metrika, Vol. 66, 323-354, 2007Multivariate conditional versions of Spearman's rho and related measures of tail dependence (with R. Schmidt), Journal of Multivariate Analysis, Vol. 98, No. 6, 1123-1140, 2007. Multivariate Extensions of Spearman's Rho and Related Statistics (with R. Schmidt), Statistics and Probability Letters, Vol. 77, No. 4, 2007.