Download
1 / 22
220 likes | 365 Views
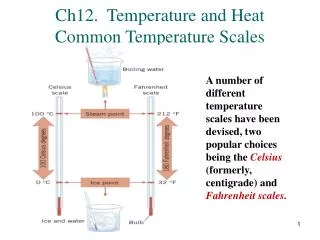
Probabilistic Temperature Forecasting: a proof of concept. Steve Amburn, Glenn Wiley WFO Tulsa, Oklahoma. Introduction. Communicate uncertainty The appropriate level Not all possibilities Forecaster should have control Determining uncertainty Use Standard Deviation based on errors

E N D
Probabilistic Temperature Forecasting:a proof of concept Steve Amburn, Glenn Wiley WFO Tulsa, Oklahoma
Introduction • Communicate uncertainty • The appropriate level • Not all possibilities • Forecaster should have control • Determining uncertainty • Use Standard Deviation based on errors • Forecaster weights guidance (MOS, etc.) • Combine fcsts/guidance similar to EKDMOS (Glahn)
Assumptions... 1. Max/Min Temperature forecast definition: The mean max or min temperature expected for an infinite number of similar events. 2. Max/min temperature forecasts have a Gaussian distribution of errors about their mean.
Are Forecasts Gaussian? • 2004-2008 data sets for TUL and FSM
Example 1 • Straight average of CCF, MAV and MET. • Final distribution in heavy black.
Example 2 • Same as example 1 but with greater disagreement of inputs.
Example 3 • MET is much cooler. CCF leaned heavily toward the MAV. Note bimodal outcome.
Example 4 • Weighted MOS and CCF. • [(2×CCF) + (1×MAV) + (0.5×MET)] / 4
Example 5 • Variable Standard Deviations skewing the final distribution
How to add forecast input? • Gridded Forecast Editor • Developed by Global Systems Division, Boulder, CO. • Used at WFOs to create gridded forecasts • Forecasters already quite familiar with software • Easily programmed to create new products • Tools already available to weight guidance products.
Equal weights of selected guidance Tools in GFE Create specific weights of selected guidance
Forecast at a Glance Hyperlink temperature to expected distribution...
Thoughts • Ensemble approach may be good, but may not include the solution a forecaster is seeking. • WFO approach • Forecaster effort not significantly increased • Forecasters can add meso-scale or micro-scale detail • Forecasters can select targets of opportunity • WFO approach can be automated if desired.
Summary • Probabilistic temperature forecasting is doable at WFOs...now. • Forecast mean temperatures • Use standard deviations based on errors to make computations • Forecasters “weight” the inputs • Forecasters must be able to work on subsynoptic-scale • Forecasters know more than a CCF number
Thank you....Probabilistic Temperature Forecasting:a proof of concept Steve Amburn, SOO WFO Tulsa, Oklahoma 918-832-4115