Download
1 / 24
240 likes | 339 Views
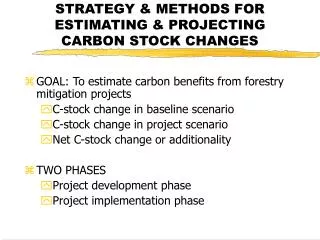
Uncertainty Analysis for a US Inventory of Soil Organic Carbon Stock Changes. F. Jay Breidt Department of Statistics Colorado State University Stephen M. Ogle and Keith Paustian Natural Resources Ecology Laboratory Colorado State University. Why Inventory Soil Carbon Stocks?.

E N D
Uncertainty Analysis for a US Inventory of Soil Organic Carbon Stock Changes F. Jay Breidt Department of Statistics Colorado State University Stephen M. Ogle and Keith Paustian Natural Resources Ecology Laboratory Colorado State University
Why Inventory Soil Carbon Stocks? • Solar energy transmitted to earth as visible and ultraviolet radiation • Radiation absorbed by surface gets re-radiated as infrared • Greenhouse Gases (GHGs) • pass visible and UV, but trap infrared: greenhouse effect • include (among others) water vapor, methane, nitrous oxide, CO2
Carbon Sequestration • Lithosphere: fossil fuels, limestone, dolomite, chalk • Oceans: shells, dissolved CO2 • Biosphere: organic molecules in living and dead organisms • Soils: organic matter
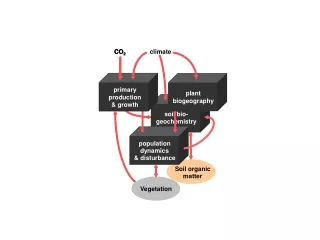
Agricultural Management and Carbon Storage • Tillage, fertilization, irrigation, etc. all affect carbon storage • Century, a biogeophysical process model, describes site-specific dynamics in an agricultural system • tracks carbon, water, nutrient cycling over long time scales (centuries to millennia) • requires inputs on soils, weather, agricultural management • deterministic output for given inputs
Carbon Dynamics in Century Metherell, Harding, Cole, & Parton 1993
Inventory Goal • Estimate total carbon stock change for US agricultural soils, 1990-2004 • Report to United Nations Framework Convention on Climate Change • pre-Kyoto agreement; nearly universal • Use Century to model carbon stock change across US • need Century inputs on nationally-representative set of sites in US agricultural lands
USDA National Resources Inventory (NRI) • Nationally-representative set of sites in US agricultural lands • Stratified two-stage area sample • Fine stratification with two primary sampling units (PSUs=quarter sections) for every 1/3 township • Three secondary sampling units (points) per PSU • Many points have • same county, MLRA, weather • same categorical values of cropping history, soil, etc. • Run Century at NRI “superpoints”
NRI Handles Sampling Uncertainty • NRI is a nationally-representative probability sample • straightforward and unbiased expansion of point-level data to national total carbon stock change • consistent design-based variance estimation and valid confidence intervals • NRI contains many key Century inputs • site-level cropping history, soil properties
Input Uncertainty • Not all needed Century inputs are in NRI • Weather: (but treat as known from PRISM: local interpolation of station data) • Tillage: use county-level Conservation Technology Information Center data • Organic amendments: use county-level USDA Manure Management Database • Fertilizer: use county-level USDA-ERS Cropping Surveys
Tillage • Traditional Tillage: • after harvest, field contains crop residues • tillage turns over the soil to bury residues • often repeated several times prior to planting • Conservation Tillage: • Reduced-Till: limited tillage; substantial crop residues on surface • No-Till: doesn’t use tillage; all crop residues left on surface
Tillage Input Distribution • Conservation Technology Information Center (CTIC) collects county-level information • construct discrete distributions for Monte Carlo (CTCT, CTRT, CTNT, RTRT, RTNT, etc.) • draw from these distributions to reflect uncertain inputs Photo courtesy of USDA
Organic Amendments and Fertilizer • Organic amendments and fertilizer not included in NRI • Use USDA Manure Management Database • county-level data • construct distributions for Monte Carlo • combine with USDA-ERS cropping survey information to account for negative correlation with fertilizer Artwork courtesy of the Wisconsin Department of Natural Resources
Model Uncertainty • Century is imperfect • For some long-term experimental sites, have • measured carbon stock changes • modeled carbon stock changes from Century • complete set of inputs, plus additional covariates • Adjust using regression of measured on modeled
Adjusted Century Output estimated from data • Experiment sites • No attempt to estimate Century rate parameters from these data (very high dimension) error with dependence from repeated measures measured carbon stock known covariates
Expansion to National Total • Ideal expansion estimator • Feasible known covariates MC from sampling distribution r th replicate estimate of national total MC from modeled distribution
Complete Uncertainty Analysis Framework correlated (sampling) Cropping History
Combining Design and Monte Carlo Uncertainties • Define • second-order inclusion prob: • design covariance: • MC expectation: • MC covariance: • Unconditional variance • model uncertainty • input uncertainty • sampling uncertainty
Variance Estimation • Combination of MC replication and design-based methods for (unreplicated) sample • usual MC variance estimate • usual design-based variance estimate for MC averages (SAS proc surveymeans or PCCARP once) • average of design-based variance estimates across MC reps (SAS proc surveymeans or PCCARPR times)
Variance Estimation, Continued • Unbiased estimator of V is then • But note that • Simpler (saves R variance computations), conservative estimator
Implementation • n=123K NRIsuperpoints in cropland, from almost 1M total NRI points • R=100 MC reps for each NRI superpoint • 12.3M Century runs • Compute estimates and uncertainties at national level as well as for interesting domains
Summary • National inventory of carbon stock changes, using variety of data sources • Combine Monte Carlo and design-based methods to account for • sampling uncertainty • input uncertainty • model uncertainty • First phase in ongoing study • Future improvements: • Incorporate remote sensing data for estimating crop and forage production • Account for emissions of N2O associated with agricultural management