Download
1 / 36
360 likes | 368 Views
Year 5 Block 3- Statistics. WR Small Step-Read and interpret line graphs NCLO: Solve comparison, sum and difference problems using information presented in a line graph. Complete, read and interpret information in tables including timetables. Mathematical Talk.

E N D
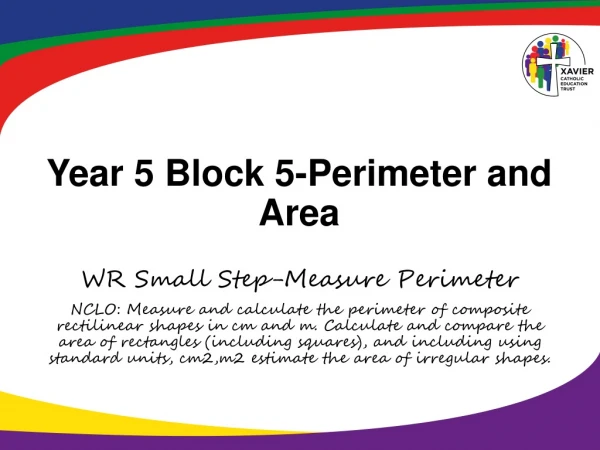
Year 5 Block 3- Statistics • WR Small Step-Read and interpret line graphs • NCLO: Solve comparison, sum and difference problems using information presented in a line graph. Complete, read and interpret information in tables including timetables.
Mathematical Talk • What do you notice about the scale on the vertical axis? • What would happen if you used a different scale? • Can you think of two questions to ask each other about your graph? • Where have you seen information presented in line graphs? • Is it clear?
What was the lowest temperature recorded on the graph? What was the time when freezing point was reached? Can you estimate what the temperature was at 6pm? The temperature was below 0°C for ____ hours. Fluency
How many children got the award on day 9? How many more children got the award on day 1 than on day 7? How many awards were handed out altogether over the first 5 days? Which days were no awards given out? Can you write some questions for your friends to answer? Fluency
The graph shows how many cars were sold by two different companies in the first 5 months of 2017. Blue represents Ace Motors and red represents Briggs. How many more cars did Ace Motors sell than Briggs in April? • For the first 3 months of the year compare the total sales for each company. Who sold more and by how many? • Crooks Motors sold 250 more cars than Briggs each month. Plot their sales on the graph. Reasoning and Problem Solving
Year 5 Block 3- Statistics WR Small Step- Draw line graphs NCLO: Solve comparison, sum and difference problems using information presented in a line graph. Complete, read and interpret information in tables including timetables.
What intervals will you use? What will each square represent? What does the x axis represent? What does the y axis represent? Why are line graphs useful? What makes them different to other types of graphs? What data could we collect? Mathematical Talk
Here is a table showing the conversion between pounds and rupees. Put the information into a line graph. Fluency
Here is a line graph showing the effect that exercise had on Jimmy’s heart during Monday’s PE lesson. Reasoning and problem solving Draw the graph again using different intervals so that you can gather more accurate information from it. What was Jimmy’s heart rate at 1min 15secs? At what time was Jimmy’s heart rate 130 beats per minute?
Year 5 Block 3- Statistics • WR Small Step- Use line graphs to solve problems • NCLO: Solve comparison, sum and difference problems using information presented in a line graph. Complete, read and interpret information in tables including timetables.
Mathematical Talk How is the information organised? Is it clear? What else does this graph tell you? What does it not tell you?
Carry out your own exercise experiment and record your heart rate on a graph like the one shown in the section above. How does it compare? Can you make a set of questions for a friend to answer about your graph? Can you put the information into a table? Reasoning and problem solving
Here is a line graph showing a bath time. Can you write a story to explain what is happening in the graph? Reasoning and problem solving How long did it take to fill the bath? How long did it take to empty? Why is there a difference? What happened when the height of water reached around 16cm?
Year 5 Block 3- Statistics • WR Small Step-Read and Interpret Tables • NCLO: Solve comparison, sum and difference problems using information presented in a line graph. Complete, read and interpret information in tables including timetables.
Mathematical Talk Can you find the information on the table? Can you make up your own question to ask about the table?
Reasoning and problem solving True or false? • The fourth largest stadium is The San Siro • There are 6 stadiums with a capacity of more than 80,000 • Three of the largest stadiums are in England
Year 5 Block 3- Statistics • WR Maths-Two way tables • NCLO: Solve comparison, sum and difference problems using information presented in a line graph. Complete, read and interpret information in tables including timetables.
Mathematical Talk What does the table show? What information is missing? How can we calculate the missing information? How else could this data be represented?
This table shows how many football games teams have won and lost. Fill in the totals and write your own questions to interpret the information. Fluency
120 people were asked where they went on holiday during the summer months of last year. Use this information to create a two way table. In June, 6 people went to France, 18 went to Spain and 5 went elsewhere. In July, 10 people went to France, 19 went to Italy and 2 went elsewhere. In August,15 people went to Spain.33 people went to France altogether. 29 people went to Italy altogether. 35 people went away in June. 43 people went on holiday in August. Reasoning and problem solving
Year 5 Block 3- Statistics WR Maths-Timetables NCLO: Solve comparison, sum and difference problems using information presented in a line graph. Complete, read and interpret information in tables including timetables.
Mathematical Talk How often does a bus leave ____ station? How many buses leave each hour? Where do you see timetables and why are they useful? What information is displayed in a row when you read across the timetable? What information is displayed in a column when you read down the timetable?
Fluency On the 06:35 bus, how long does it take to get from Shelf Roundabout to Bradford Interchange? • Can you travel to Woodside on the 07:43 bus? • Which journey takes the longest time between Shelf Village Hall and Bradford Interchange, the bus that leaves SVH at 06:46 or the bus that leaves SVH at 07:23? • If you needed to travel from Halifax Bus Station to Odsal and had to arrive by 08:20, which would be thebest bus to catch? Explain your answer. • Which journey takes the longest time from Halifax Bus Station to Bradford Interchange?
Simon scans the TV guide and plans his viewing for the evening. He chooses this sequence of TV shows: Cheese Please, What’s the Q, aMAZEment, Budget Baker, Safari, Dance & Decide. Will Simon be able to watch all the shows he has chosen? True or False – Safari, Guess the Noise and Lots of Lollies are all on for 1 hour.
True or false: • If Becky was 10 minutes late for her English lesson on Monday there would be 45 mins of the lesson left. • Becky has 2 hours and 20 minutes of PE in a week • Becky has 130 minutes of literacy in a week