Download
1 / 21
210 likes | 347 Views
Time series monitoring in Japan (Introduction of Odate collection and Odate project) Hiroya Sugisaki ・ Kazuaki Tadokoro ・ Sanae Chiba. PH-line. PM-line. PA-line. winter/summer. PK-line. PN-line. *P は pollution の略. Regular sampling lines organized by Japan Meteorological Agency

E N D
Time series monitoring in Japan (Introduction of Odate collection and Odate project) Hiroya Sugisaki・Kazuaki Tadokoro・Sanae Chiba
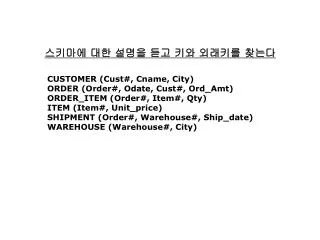
PH-line PM-line PA-line winter/summer PK-line PN-line *Pはpollutionの略 Regular sampling lines organized by Japan Meteorological Agency (from K.Tadokoro:TNFRI) Zooplankton has been collected seasonally since 1972
Sampling stations organized by Fisheries Research Agency and local fisheries research institutes T,S and Zooplankton biomass has been researched since early1950s in order to forecast fisheries condition ODATE collection/data area
Active projects on field monitoring study in FRA,Japan A-Line(current: 1990~) Odate Project(retrospective :1950~2000) O-Line(current: 2002~)
4 6 N4 N3 4 5 N2 ) N1 N 4 4 e e Hokkaido r Akkeshi g e 4 3 d A1 ( e d A4 4 2 u t i t A7 a L 4 1 A11 4 0 Honshu A15 3 9 3 8 140 141 142 143 144 145 146 147 Longitude (degree E) A-Line well organized by HNF and TNFRI (PI: Tsuneo Ono) 5-8 cruises/yr. since1990 not only standard oceanographical monitoring, but also mechanisms of biological production or biological carbon transportation has been researched
What is Odate collection? • More than 20000 zooplankton samples (formaline preserved) are stocked at Tohoku National Fisheries Research Institute, Fisheries Research Agency Japan. • Long term variation of biomass (total wet weight) of this sample set was analyzed by Dr. Kazuko Odate (Odate, 1994). • The samples are still available for identification of species, because preserved condition is good.
Sampling, Monitoring • The purpose of the zooplankton sampling was routine monitoring of prey abundance of fishery ground and oceanic environment. • Zooplankton samples have been collected by several public fisheries institutes in north eastern region of Japan since 1950. • Sampling gears are conical standard plankton net (45cm diameter; 0.33mm mesh size). • Net was towed vertically from 150m depth layer to the surface.
Long term variation of zooplankton biomass based on Odate collection Zooplankton biomass(mgWW/m3) low low HIGH HIGH (revised from Odate,1994)
Analysis of species composition of zooplankton using Odate collection Mere monitoring on long-term variation of zooplankton Research on the mechanisms of long term variation of ecosystem Information on only total wet weight is not sufficient to analyze the interaction of biological phenomenon and climate change
Retrospective analysis of species composition of copepods using Odate collection = Odate Project FY2003-2005 Financial supported by Japanese ministry of the Environment • Species composition data base from the Odate Collectionreanalysis of species composition from Odate collection, establish the data base H.Sugisaki, T.Kobari, H.Itoh • Long term variation of Climate/Physical oceanography analysis of physical effect on long term variation of pceanic ecosystem I.Yasuda, M.Noto • Effect of biological production on the interaction between climate change and variation of ocean ecosystem interaction between physical and biological effect H.Saito • Long term variation of zooplankton communities and the process of transportation of organic matter through biological processes analysis of mechanism of long term variation of copepods composition and establish the model S.Chiba, K.Tadokoro
Identification procedure • Copepods were sorted out and identifies into species using newest information on copepod classification. • Copepodite stages (I-V)of dominant copepods (Neocalanus, Eucalanus, Calanus and Metridia species) were identified. • Total number of each classified species and life stage category were calculated.
# of Detected species Temperature of 100m depth # of Samples Year and season 1960-2001 January- November Oyashio Cold current 1528 T100<5oC 174 1960-2000 March- September Oyashio- Kuroshio transition 236 5oC<T100<15oC 1358 1960-1969 (1960-2000 at the final result) 63 (ca. 1200 at the final result) 145 (1960’s) Kuroshio Warm current T100>15oC
20 15 10 5 0 70 75 80 85 90 95 100 Year (+1900) Hypothesis: top-down control (Tadokoro et al., 2005) Feeding rate of Japanese sardine was estimated 32-138% of Neocalanus production rate in 1984 Migrate into the Oyashio during summer Standing stock of sardine (million ton)
18.6 yr tide cycle Hypothesis: bottom-up control (Tadokoro et al., PICES XV) Oyashio Mixed Sea surface 1.0 0.5 0.9 0.8 0.4 PO4 (m mol m-3) 0.7 0.3 0.6 0.5 0.2 0.4 60 70 80 90 100 60 70 80 90 100 Subsurface layer 2.6 2.3 2.5 2.2 2.4 PO4 (m mol m-3) 2.1 2.3 2.2 2.0 2.1 1.9 60 70 80 90 100 60 70 80 90 100 Year(+1900)
0.5 0.4 -92% -91% PO4 (m mol m-3) -64% -56% 0.3 0.2 PO4 0.1 Hypothesis: bottom-up control (Tadokoro et al., PICES XV) N. Plumchrus biomass had significant relationship with PO4. Oyashio Mixed 0.9 15 7 6 0.8 5 0.7 10 biomass (g m-2) 4 0.6 3 0.5 5 2 0.4 1 0.3 0 0 60 70 80 90 100 60 70 80 90 100 Y ear (+1900) Those relationships suggests the change in nutrients condition affect N. plumchrus biomass due to change the primary productively.
After the mid 1970s Lower tropic level responses to the 1976 and 1988 RS : (winter-spring processes) After the late 1988s (Chiba et al, submitted, PO)
In order to reveal the mechanisms of variability of ecosystems, World-wide Collaborative research is necessary CMarZ should be a good platform
The result will be open at the web site near future (Ex.) Long term variation of abundance of Neocalanusplumchrus (Ex.) distribution map of Neocalanusplumchrus