Download
1 / 32
320 likes | 652 Views
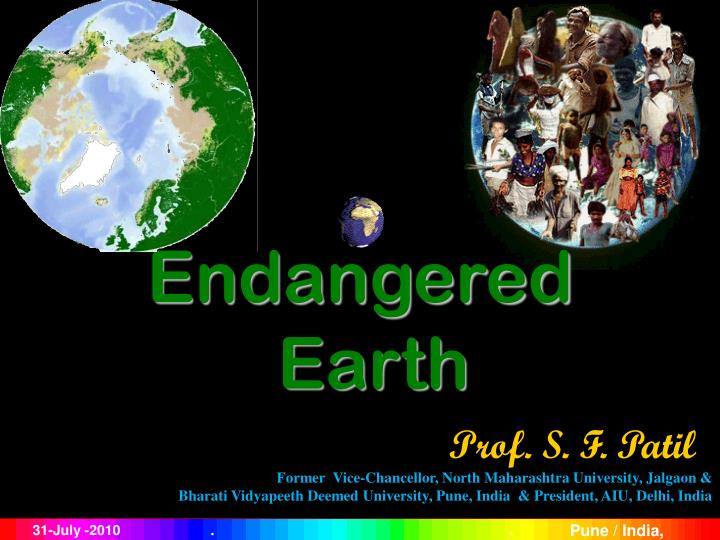
Endangered Earth. Prof. S. F. Patil Former Vice-Chancellor, North Maharashtra University, Jalgaon & Bharati Vidyapeeth Deemed University, Pune, India & President, AIU, Delhi, India. ·. Pune / India,. ·. 31-July -2010. Major environmental conferences. WARNING…..

E N D
Endangered Earth Prof. S. F. Patil Former Vice-Chancellor, North Maharashtra University, Jalgaon & Bharati Vidyapeeth Deemed University, Pune, India & President, AIU, Delhi, India · Pune / India, · 31-July -2010
WARNING….. World Watch Institute Washington DC (1992) 1575 world famous scientist’s including 99 Nobel Laureates from 69 countries said that mankind has a few decades left to avoid ruin through current rate of disposal of the Earth’s resources. They concluded “unless there is a worldwide change of policy, the world is threatened with a grim scenario of wars of distribution, mass migration, misery and devastation.” The most urgent problems singled out were: Air pollution Squandering of drinking water Destruction of rain forests Unsustainable use of resources Over population Dumping poisonous waste in the seas
PRIMARY POLLUTANTS • There are five primary pollutants which together contributes more than 90% of global air pollution Carbon Monoxide , CO Nitrogen Oxides, NOx Hydrocarbons, HC Sulphur Oxides, SOx Particulates Transportation accounts for more than 46% of the pollutants produced per year
Primary pollutant sources and amounts in M tons/ year in USA (1976) Source: National Quality and Emission Trends Report USA-1976
Sources of CO Annual global scale: 350 M tons USA alone releases 100 M tons of CO / year Major sources • Transportation:64% of total CO ( Motor vehicles:59.2%, Air craft : 2.4 % and Railway : 0.1 %) • Forest fires &.2 % • Agricultural burning : 8.3 % • Industrial processes: 9.6 % Human activities : 275 M tons Natural : 75 M tons
730 800 580 700 600 479 500 400 215 300 112 200 83 12 21 40 100 0 China Pacific Africa Canada East Europe West Europe Asia Far East Asia, Middle East Central South America Vehicles per 1,000 persons in different regions/countries Source: US Department of Energy, 2005
CO2 emission from fossil fuel combustion (1998) 6,000 5,480 5,000 4,000 2715 3,000 (Million metric tons of CO2 per year) 2,000 1,485 1,058 926 834 1,000 540 508 440 391 373 306 0 Italy India China Japan Russia France Canada S Africa Australia Germany United States United Kingdom Source: US Environmental Protection Agency, 2000
Air pollution : Health hazards • Every year, approximately 0.8 million deaths are attributed to urban air pollution (Source: ‘The Leapfrog factor’, Centre for Science and Environment, New Delhi and World Watch Institute, 2006) • 9600 deaths due to skin cancer and 1,54,900 deaths due to lung cancer were reported in the US in 2002. ( Source American Cancer Society, Inc. 2002) • In China and India 0.59 million and 0.46 million people respectively die annually due to urban air pollution alone. (Source: World Bank, 2006)
Smoking: Is it known to you? Nicotine: In cigarette 0.9-1.8 mg In bidi 1.7-2.8 mg Tar : In cigarette 19-28 mg In bidi 23-41 mg • Carbon monoxide in smoke prevents the use of oxygen. • Hydrogen cyanide is a poisonous chemical which destroys the respiratory tract. • Phenyl benzopyrine is carcinogenic. Consequences: cancer of lungs, mouth, throat, digestive tract, vocal chord etc. blood pressure, heart trouble, weakness, loss of appetite and malnutrition.
The Planet’s water (1400 M km3) 19600 m3
Water usage facts • Presently, 1.1 billion people lack access to water supply and 2.4 billion to sanitation. • By 2050, 7 billion people in 60 countries may face water scarcity . • There is a severe inequity in water distribution. A child in a developed country consumes 30-50 times more water than the developing country. • Everyday 2 million tons of waste is poured into water, while 1 litre of waste water pollutes 8 litres of fresh water. • Source: State of the world 2004, The World Watch Institute, USA, 2004
During the World Water Conference (1977) a Syrian delegate remarked that water will be more expensive than diesel in future.
Impact of water pollution • Everyday, about 29,000 children under the age of five die from causes that are easily preventable such as diarrhea, dehydration and malaria. • Malaria causes more than 300 million acute illness and one million deaths annually • Between 2000 to 2004, more than 3,000 people died globally due to yellow fever • Former Director General of WHO (Dr. Halfdan) said that, ‘The number of water taps per 1000 persons is a better indication of health than the number of hospital beds’. Source: UNICEF, 2004, New York, USA / World Health Organization, 2004
Diseases caused by some trace elements in water Mn: (about 0.1 mg/ lit) causes loss of memory, impotence and eye diseases Hg: (about 0.001 mg/lit) causes loss of vision, hearing and intellectual abilities. As (about 0.05 mg/lit ) is carcinogenic Cd (about 0.005 mg/lit) causes cramps, nausea, vomiting and diarrhea Pb (about 0.05 mg/lit) causes intestinal cramps, peripheral nerve paralysis, anemia and fatigue. In children it causes damage to brain and mental retardation. F: (about 3 mg/lit) causes fluorosis of teeth and above 4 mg/lit can cause deformation of bones.
Arsenic concentrations in Bangladeshi tubewells In Bangladesh millions of people drink Arsenic contaminated water causing cancer Source: World Health Organization 2004
Threatened Species • The number of recorded species is about 1.4 million, but the total is estimated at about 5 million species . • It has taken 3.5 billion years for this biodiversity to evolve and we are rapidly destroying it. • Natural rate of extinction is about one species per year where the present rate is estimated at 10,000 per year due to human impacts. • One in every four mammals and one in every eight birds is facing a high risk of extinction in future. Source: Threatened Species, IUCN, 2002
Year wise globally threatened species Threatened species 18000 16118 15503 16000 14000 12259 11167 11046 12000 10533 10000 8000 6000 4000 2000 0 1996/98 2000 2002 2003 2004 2006 Source: International Union for conservation of Nature, 2006
Endangered Species: Global Scenario 9000 8390 8321 8000 6774 7000 5714 5611 6000 5328 5000 4000 3000 1811 1770 2000 1183 1192 1194 1213 1206 1107 1000 124 146 157 157 0 1996/98 2000 2002 2003 2004 2006 Mammals Birds Reptiles Amphibians Plants Source: International Union for Conservation of Nature, 2006
Threatened species (2006) Red data list includes 16,118 threatened species • Vertebrates 5624 (35%) • Invertebrates 2104 (13%) • Plants 8390 (52%) Source:International Union for Conservation of Nature, 2006
Population growth of the world Source: Population Reference Bureau, United Nations, World Urbanization Prospects, 2005
Population forecasts predict that unless effective birth control measures are taken at the end of the 21st century, there will be 14,000 millionpeople living on this earth. However, the earth’s capacity for providing nourishment would probably reach its limit with a total population of 10,000 million. (Source: United Nations)
Resource consumption patterns • People are using over 20 % more natural resources each year . • The consumption pattern led to unsustainable use of natural resources. Between 1960 and 1995, worldwide use of minerals rose by 2.5 fold, metals 2.1 fold and wood products by 2.3 fold. • Consumption is highest in nations like US. An American uses 22 kg of aluminum per year, while an Indian uses 2 kg and an African less than 1 kg. • With around 5% of world population US consumes about 40% of worlds resources and emits around 21% of the worlds carbon dioxide. Source: Living planet report 2002, UK
Country Energy/ Kg CE USA 10921 Germany 6375 France 5457 Great Britain 5353 Japan 4754 Egypt 713 Sri Lanka 133 Ethiopia 25 Nepal 24 Energy consumption per head in selected countries in 1991 CE- Coal Equivalent Source: United Nations: Energy statistics Yearbook. United Nations Publications. ( New York 1994)
TODAY’S RAW MATERIAL – TOMORROW’S WASTE • Raw materials such as metals, mineral oil, gas and coal are not available for use in inexhaustible quantities. Man has always looked upon the earth’s treasures as something that could be taken for granted. • The question arises whether these resources belong to our generation alone. Do they not belong to succeeding generations? Have we the right to leave to these generations only rubbish dumps and poisonous substances in the place of resources? • Sooner or later the last barrel of oil and the last ton of iron and copper ore will be used up.
310 9.3 33 Gold 0.042 0.002 21 Lead 63 3.2 19 Zinc 140 7 20 Nickel 47 0.826 57 Manganese 800 20.4 43 World Mineral Wealth 1993Some examples from Bureau of Mines, Washington Raw Material Reserves / M tons Estimated production / M tons Last for / Year Copper
Thank You.. Website: www.bvuniversity.edu.in Email: prof.sfpatil@rediffmail.com